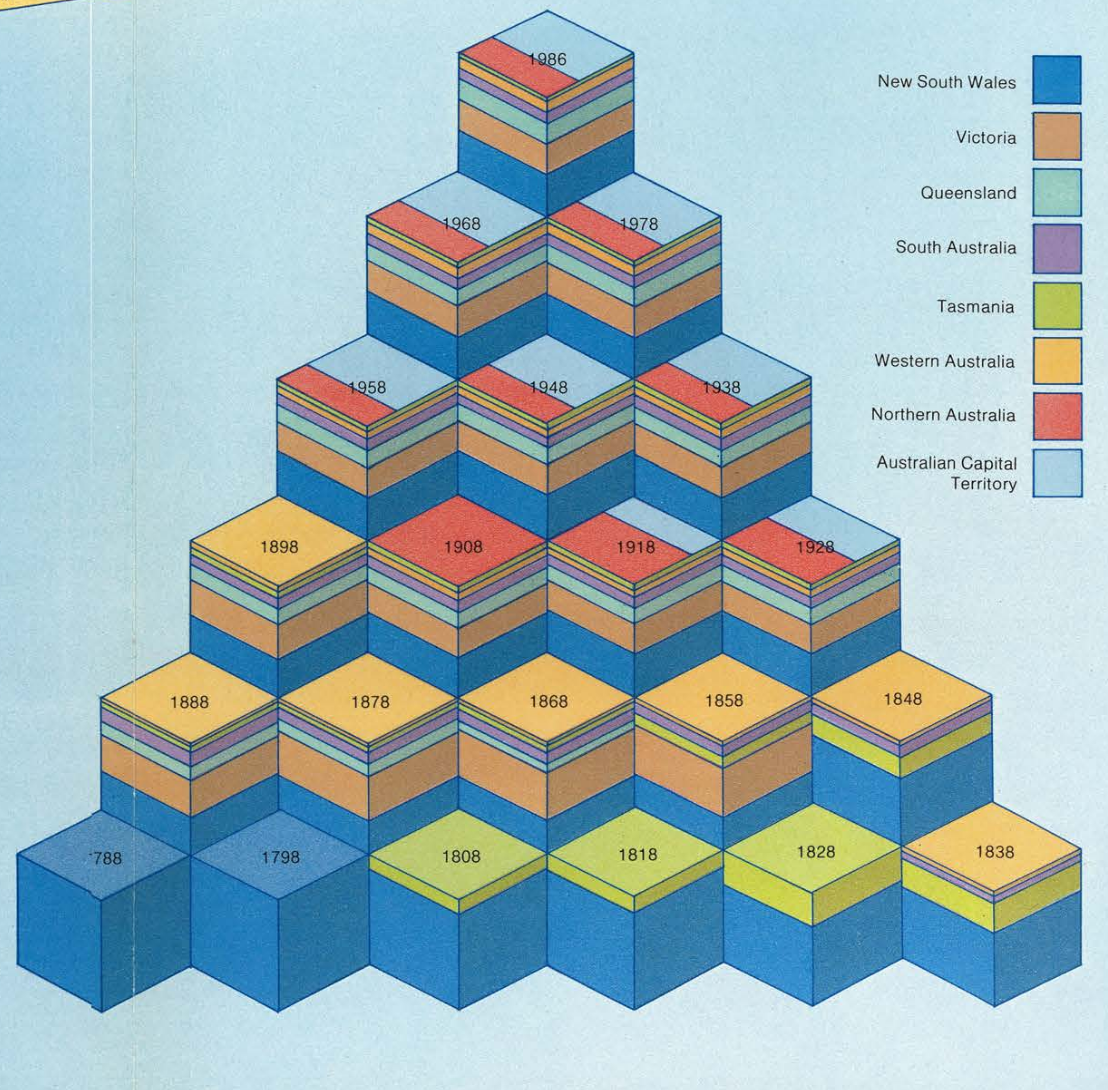
A thread of mystifying and hilarious data visualisations from the "Australians" books, published in 1987 by the Australian Government. (ht @mikejbeggs) #ausecon #chartcrimes #dataviz
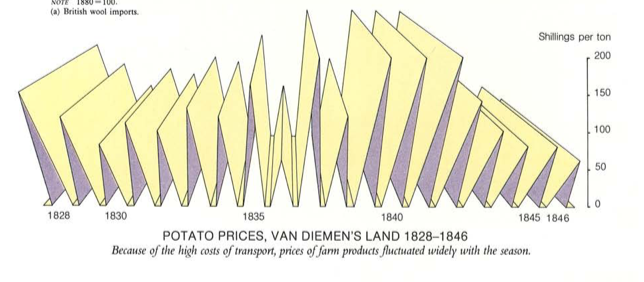
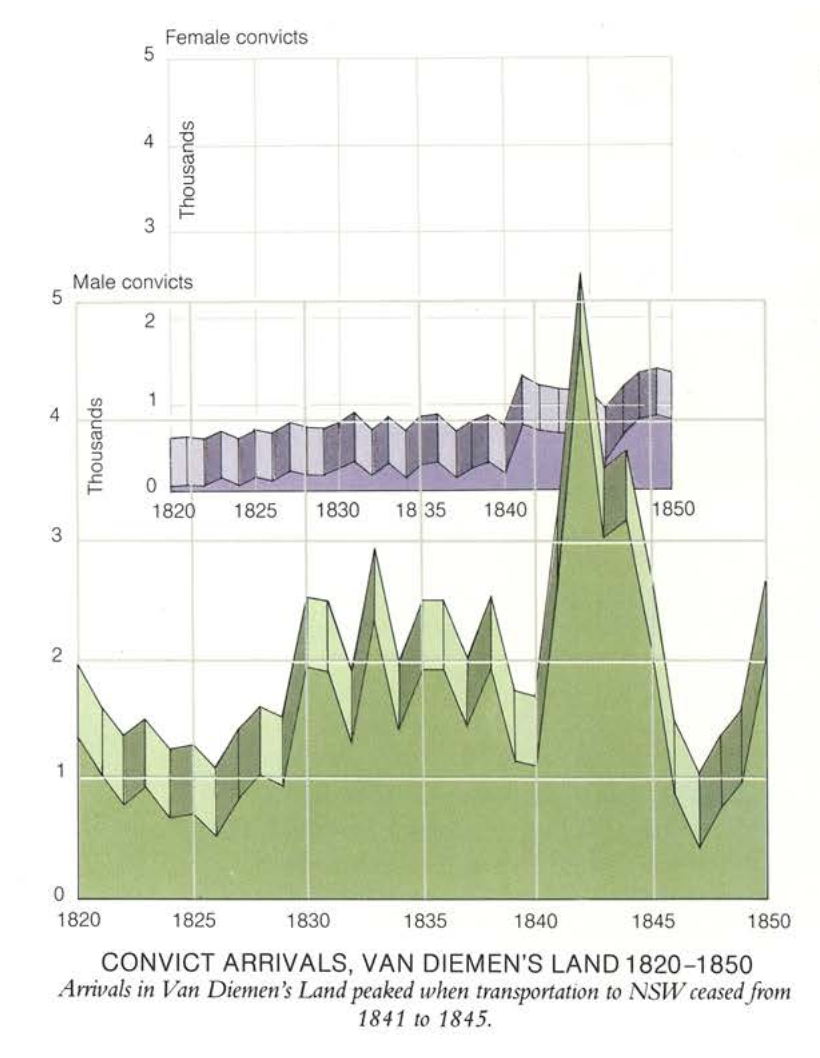
1. Spikes
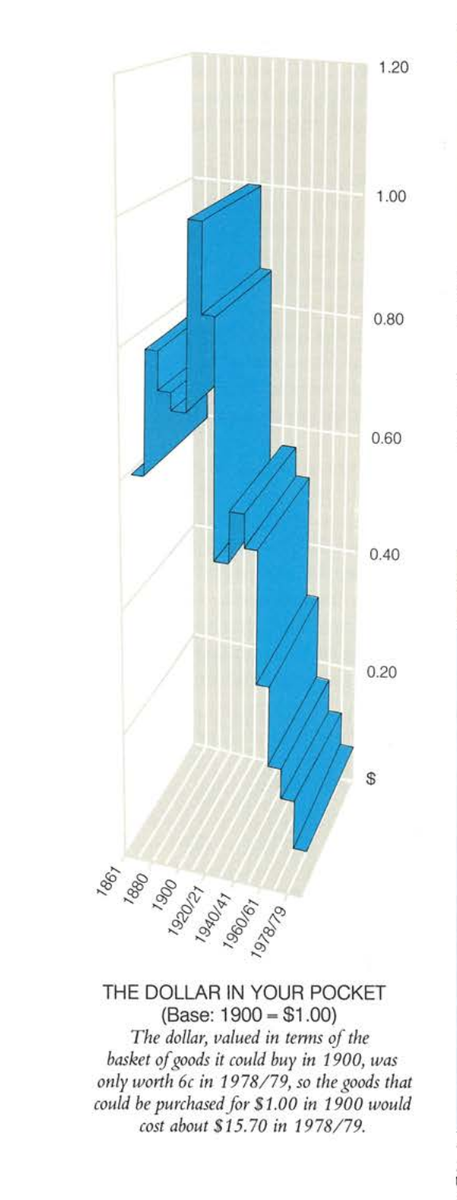
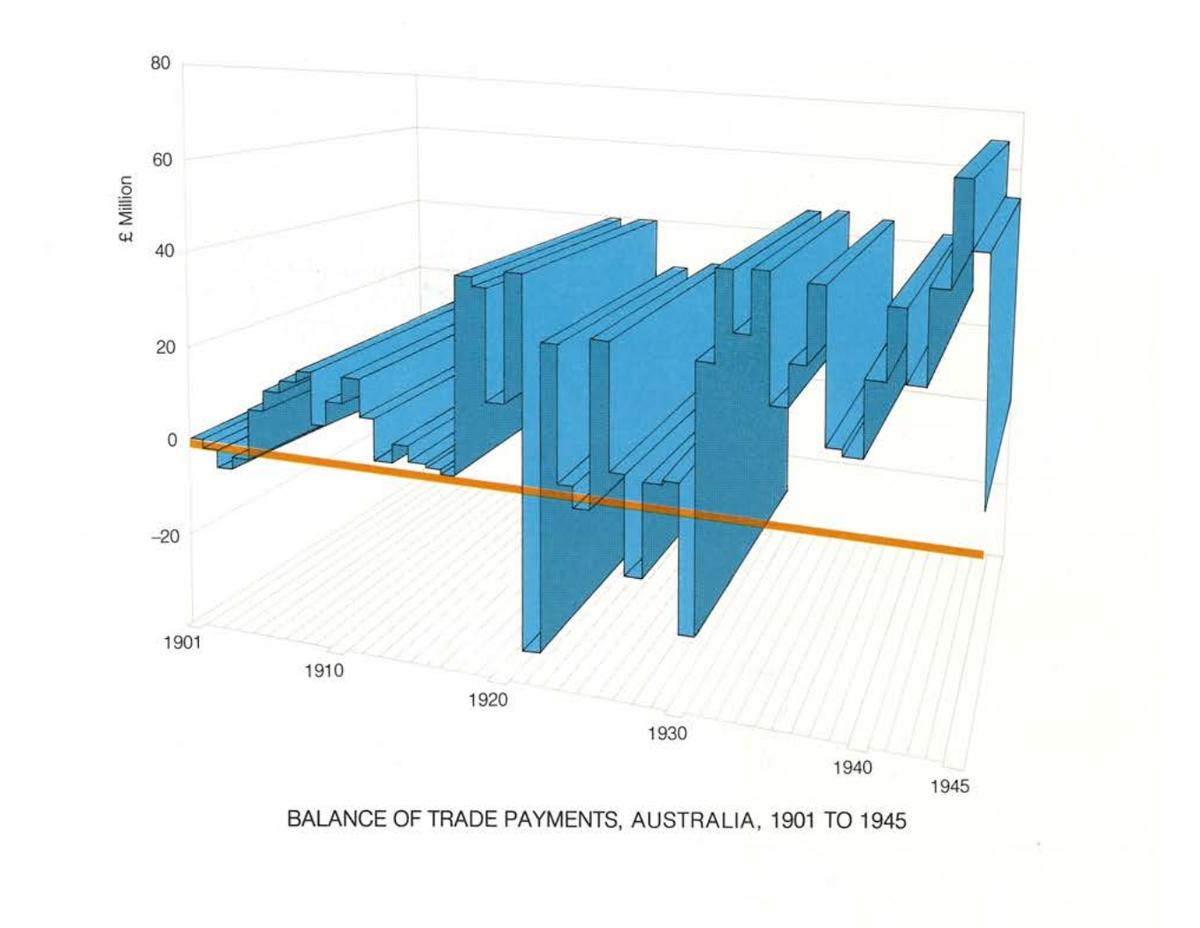
2. BLUE STAIRCASE #ausecon #chartcrimes #dataviz
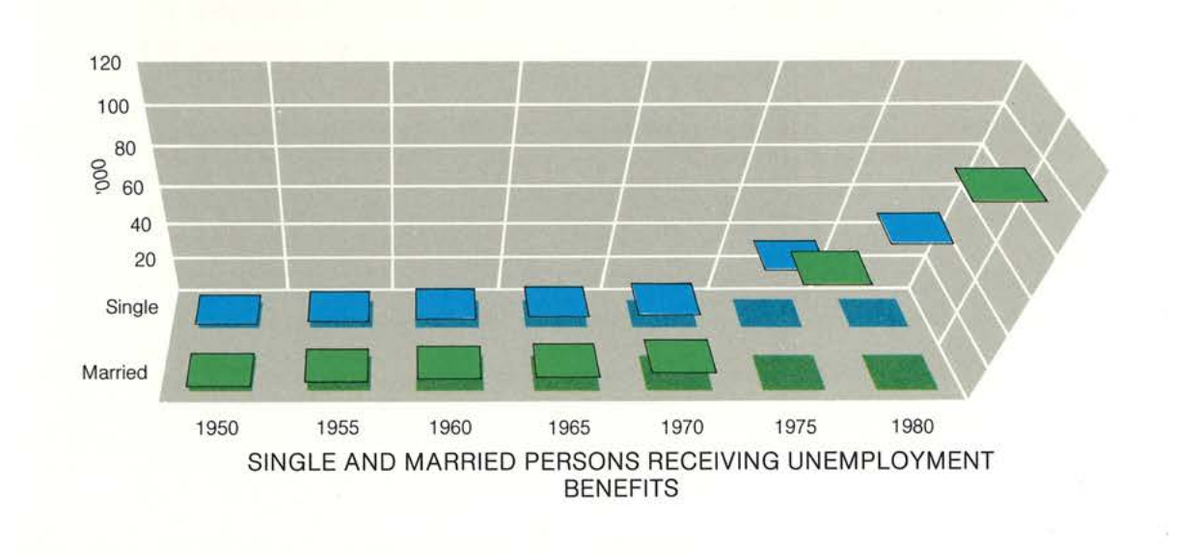
3. Wave, frozen wave of OJ. #ausecon #chartcrimes #dataviz
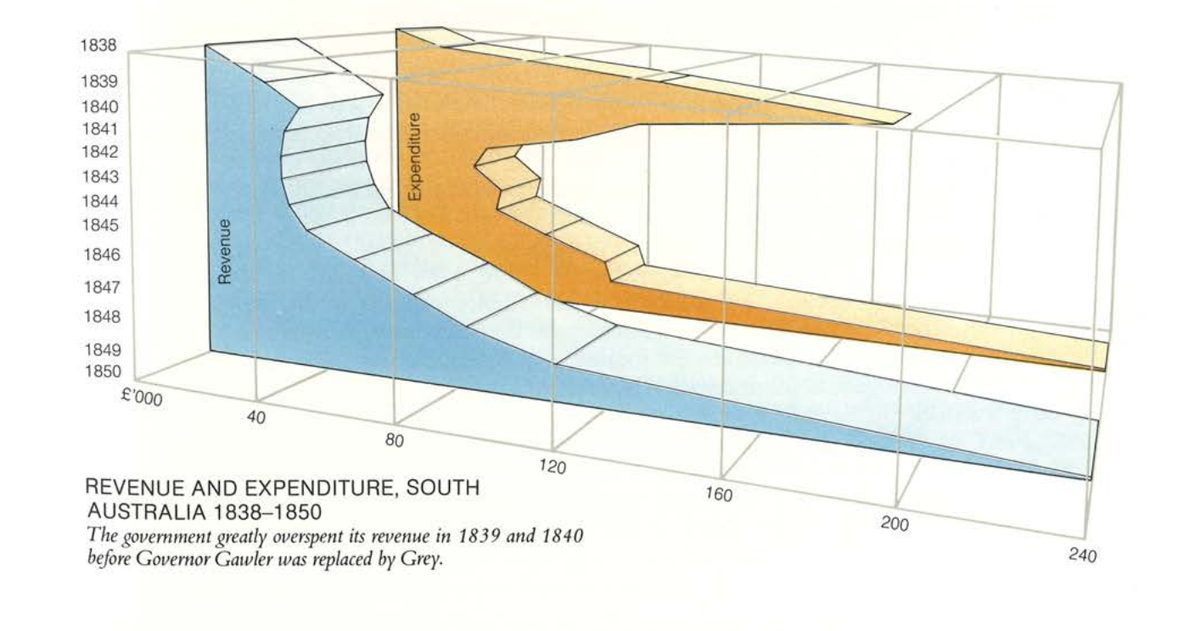
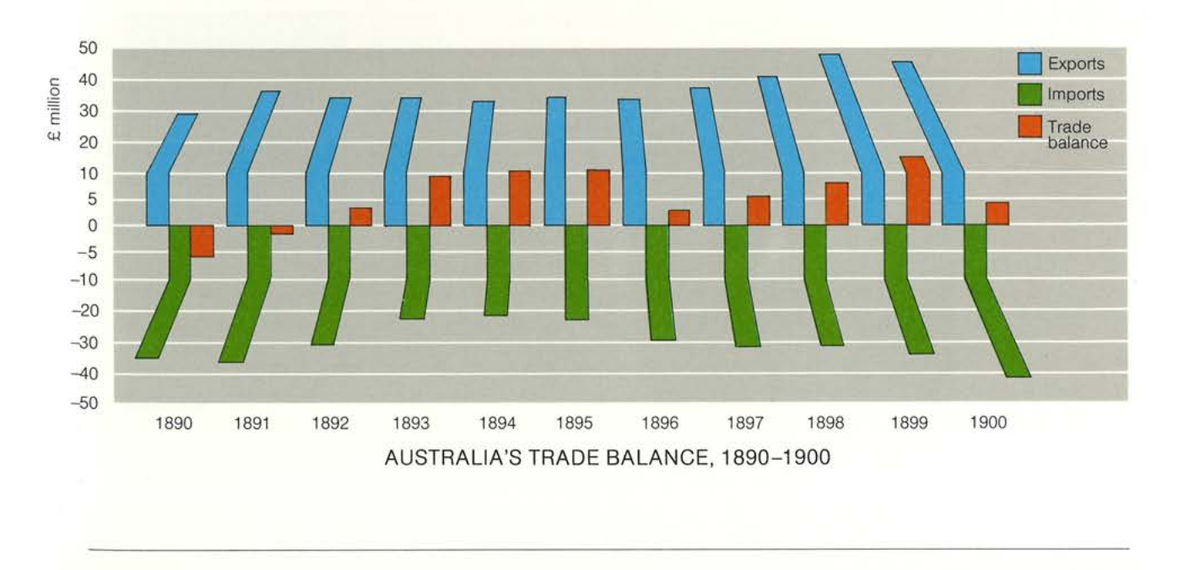
More ribbons than an artistic gymnastics locker-room #ausecon #chartcrimes #dataviz
Space efficient data presentation. #ausecon #chartcrimes #dataviz
The birds eye view. #ausecon #chartcrimes #dataviz
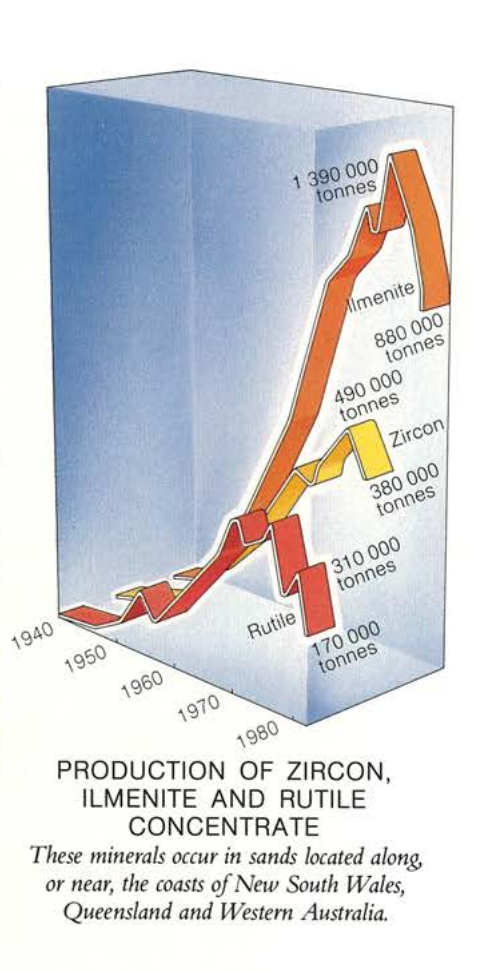
I admit this one looks cool. #ausecon #chartcrimes #dataviz
These were all originally published in 1987, and Excel has basically only just been invented, so I doubt it was used. Welcome any views on what program might have been used to generate them. #ausecon #chartcrimes #dataviz
You can follow @jasemurphy.
Tip: mention @twtextapp on a Twitter thread with the keyword “unroll” to get a link to it.

Latest Threads Unrolled:

By continuing to use the site, you are consenting to the use of cookies as explained in our Cookie Policy to improve your experience.