1/ @mjmauboussin recently published "Public to Private Equity in the United States: A Long-Term Look".
It's a 56-page document containing full of interesting data, charts, and insights. Here's a thread with some of those tidbits.
Link to full report: https://www.morganstanley.com/im/publication/insights/articles/articles_publictoprivateequityintheusalongtermlook_us.pdf?1596549853128
It's a 56-page document containing full of interesting data, charts, and insights. Here's a thread with some of those tidbits.
Link to full report: https://www.morganstanley.com/im/publication/insights/articles/articles_publictoprivateequityintheusalongtermlook_us.pdf?1596549853128
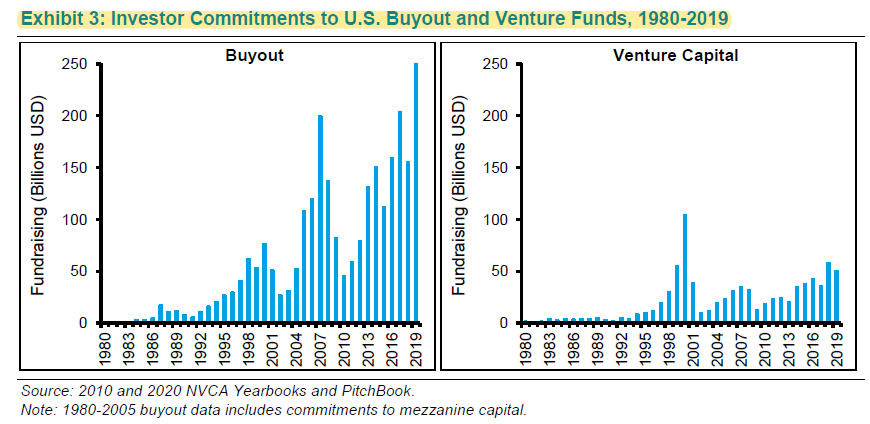
3/ Commitment to PE/VC funds have been cyclical, and strong investor commitments are followed by weak returns.
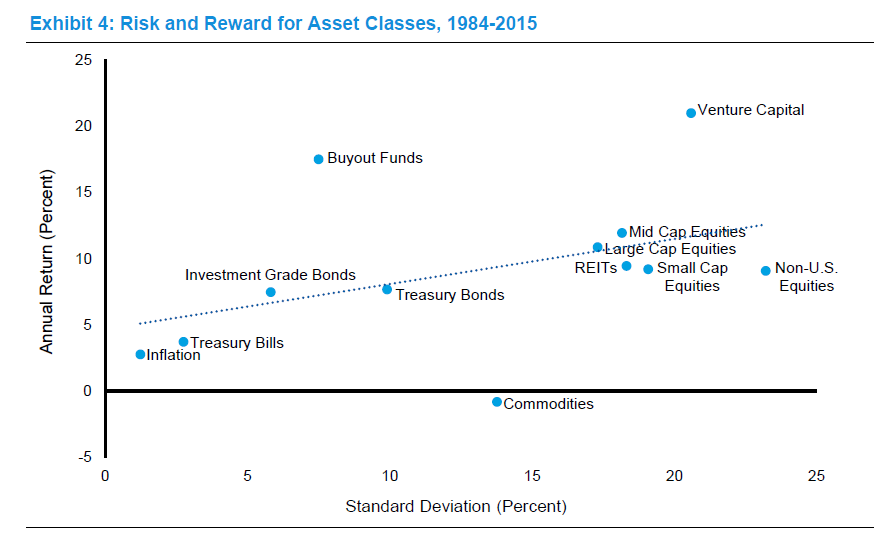
4/ Non-US equities have been such a dog asset class for a long time. Higher std dev than VC but generated close to treasury bond returns.
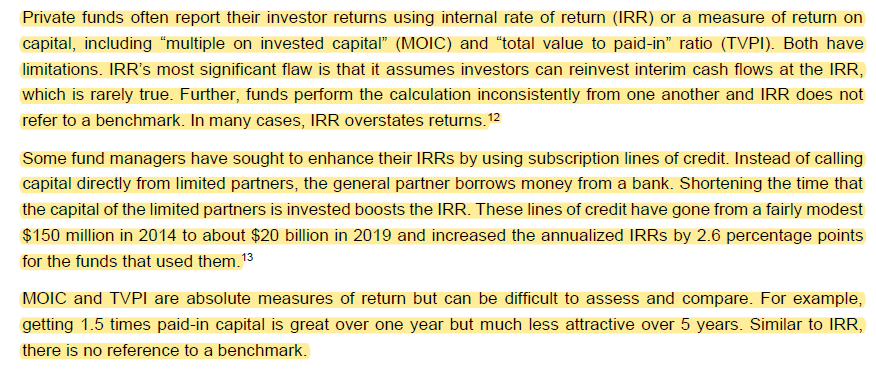
See some caveats for PE returns in the second image.
See some caveats for PE returns in the second image.
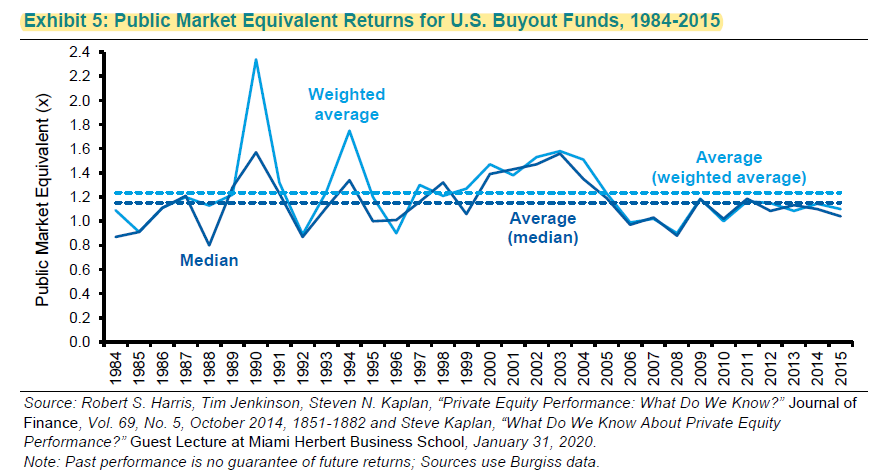
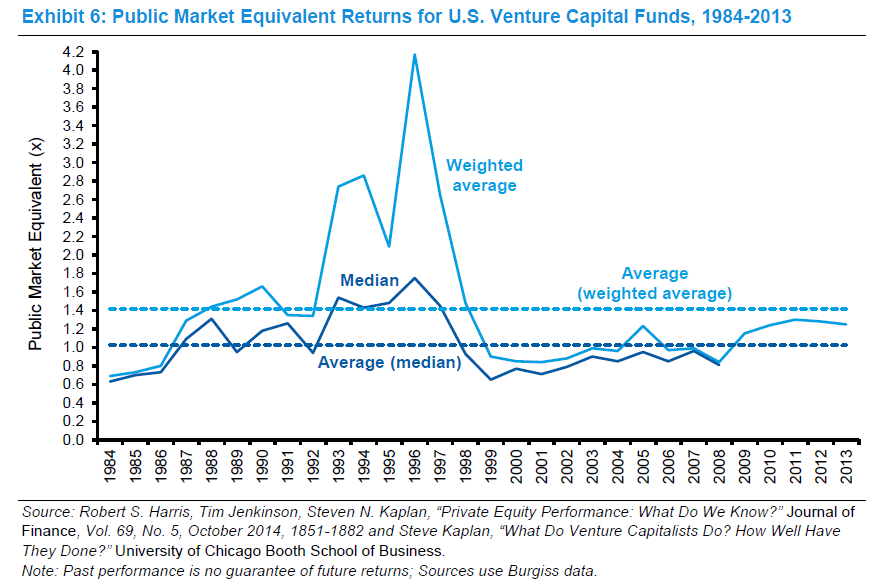
5/ Public Market Equivalents (PME) does better to make comparison across PE/VC and public markets. PME is basically the multiple of return you generate vs public markets during the same period.
Avg PME for PE was ~1.2. It becomes ~1.1 adjusting for size, sector, and leverage.
Avg PME for PE was ~1.2. It becomes ~1.1 adjusting for size, sector, and leverage.
6/ "the basic story is that PMEs were around 1.0 in the late 1980s, rose sharply during the 1990s technology boom, and then have drifted back toward 1.0 since 2000. Note that gathering consistent data is notoriously difficult"
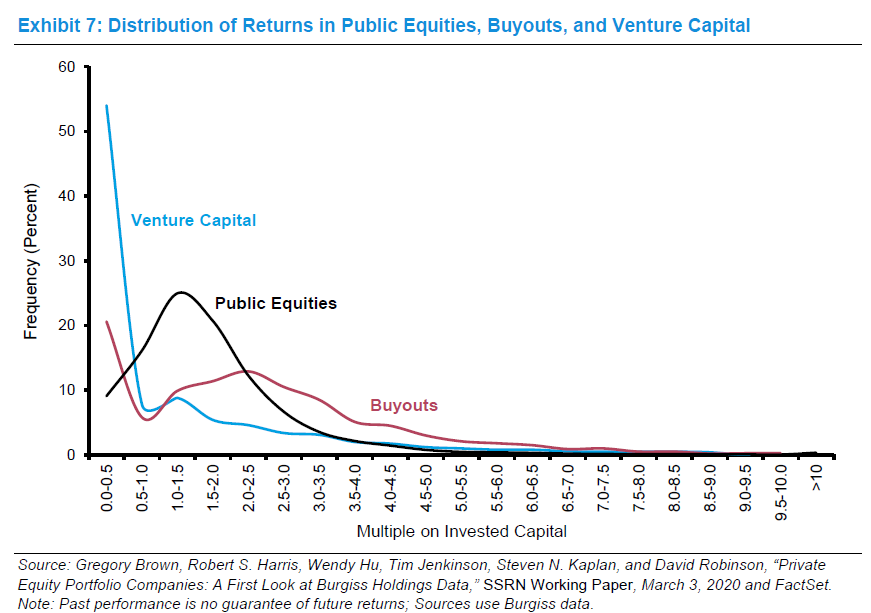
7/ As expected, VC/PE funds are more skewed than public equities.
Public equities market cap is 27x of the AUM of the buyout funds, and 80x of VC funds.
Public equities market cap is 27x of the AUM of the buyout funds, and 80x of VC funds.
8/ Now we will see "Drivers of change".
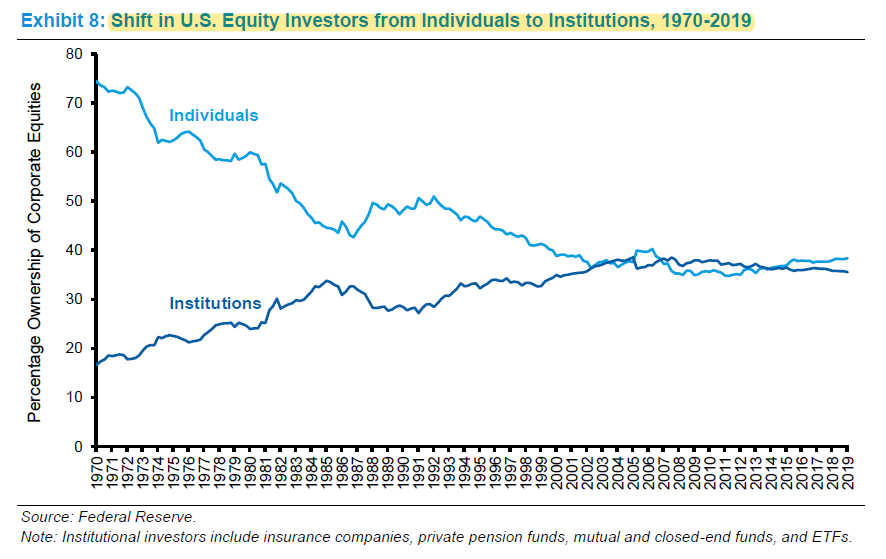
Investing has become much more institutional. # of CFAs per public company increased from 1 in 1976 to 27 in 2019.
Investing has become much more institutional. # of CFAs per public company increased from 1 in 1976 to 27 in 2019.
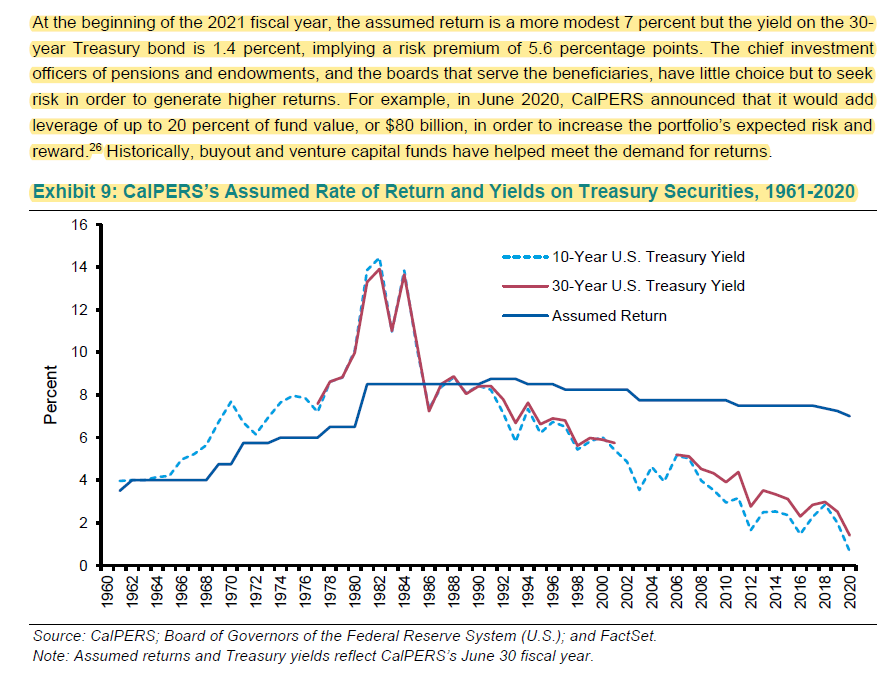
9/ Unfunded pension liabilities total $1.6 to $6 Trillion (varies by methods/assumptions)
You can contribute more to plan, provide less to beneficiary, or try to generate higher return by taking more risk. Most CIOs are still choosing the third option.
Just see CalPERS.
You can contribute more to plan, provide less to beneficiary, or try to generate higher return by taking more risk. Most CIOs are still choosing the third option.
Just see CalPERS.
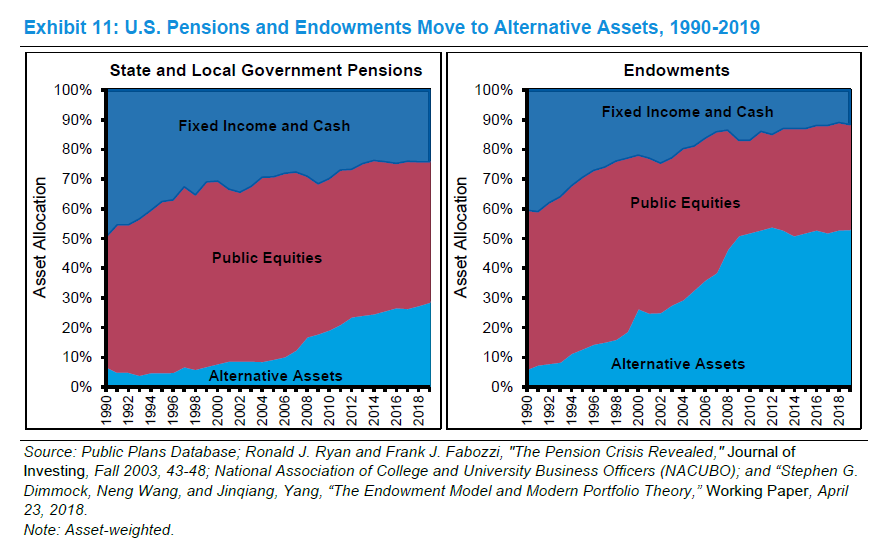
10/ Universities' dependency on endowment has increased significantly.
In 1985, Yale's endowment funded 10% of operating budget. Now it's 35%.
Since we have gradually fallen in a ZIRP world, endowments are moving from fixed income.
In 1985, Yale's endowment funded 10% of operating budget. Now it's 35%.
Since we have gradually fallen in a ZIRP world, endowments are moving from fixed income.
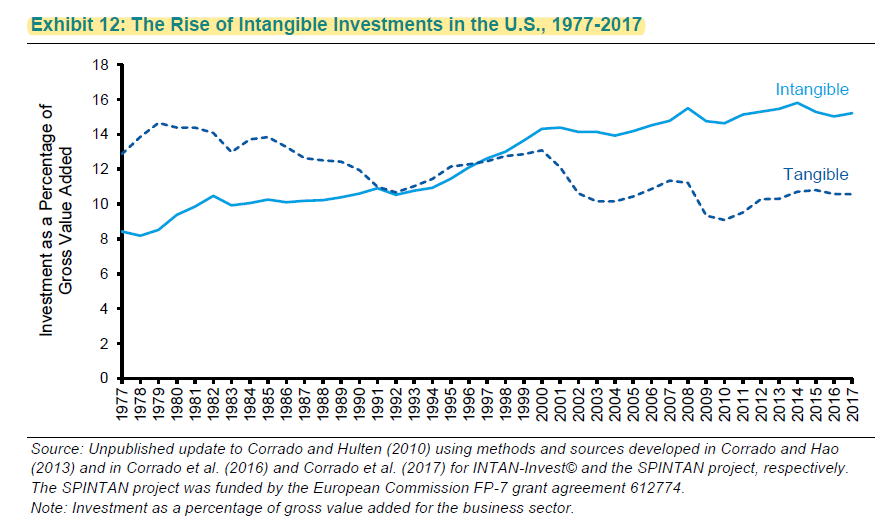
11/ The rise of the intangibles
In the 1970s, tangible investments was 2x intangibles. Today, intangibles is 1.5x tangibles.
In the 1970s, tangible investments was 2x intangibles. Today, intangibles is 1.5x tangibles.
12/ Investment in intangibles may lead to "non-rival goods" meaning more than one person can use the good simultaneously.
A physical book is a rival good. It requires more capital/labor to produce more of it. A digital book is non-rival. We can all read simultaneously.
A physical book is a rival good. It requires more capital/labor to produce more of it. A digital book is non-rival. We can all read simultaneously.
13/ In certain conditions, intangibles based cos defy diminishing marginal returns and in fact, realize increasing increasing returns.
$FB sales/employee is 2x $F's. Today, companies don't need much capital, plus access to capital is cheaper than ever.
$FB sales/employee is 2x $F's. Today, companies don't need much capital, plus access to capital is cheaper than ever.
14/ As longevity of the cos declined, it also implies rate of change increased.
A co listed in 1970s had 92% probability of survival for next 5 years. In 2000s, it was 63%.
A co listed in 1970s had 92% probability of survival for next 5 years. In 2000s, it was 63%.
15/ The gap in ROIC in the top 10 percentile vs the median has sharply increased in recent decades. Larger firms spend more on intangibles which can lead to outsized returns.
16/ Leveraged loan market was 1/6th of HY market in 2000. Today, it is almost equal in size.
CLOs have gone from 0.1% of leveraged loan market in 1994 to ~60% today.
Cov lite loans increased from 60% in 2015 to 80% in 2019.
CLOs have gone from 0.1% of leveraged loan market in 1994 to ~60% today.
Cov lite loans increased from 60% in 2015 to 80% in 2019.
17/ A company after buyout is 10x more likely to be bankrupt.
In early days, bankruptcy meant liquidation. Following 1978 inclusion of Chapter 11, reorganization of the cap structure became possible which was a huge boon for buyout funds.
In early days, bankruptcy meant liquidation. Following 1978 inclusion of Chapter 11, reorganization of the cap structure became possible which was a huge boon for buyout funds.

 Read on Twitter