Week 9 NHS Test and Trace data summary. 23/7/20 to 29/07/20.
Headline data in pic, summarised plus some questions in thread.
https://www.gov.uk/government/publications/nhs-test-and-trace-statistics-england-23-july-to-29-july-2020
Headline data in pic, summarised plus some questions in thread.
https://www.gov.uk/government/publications/nhs-test-and-trace-statistics-england-23-july-to-29-july-2020
KEY POINT.
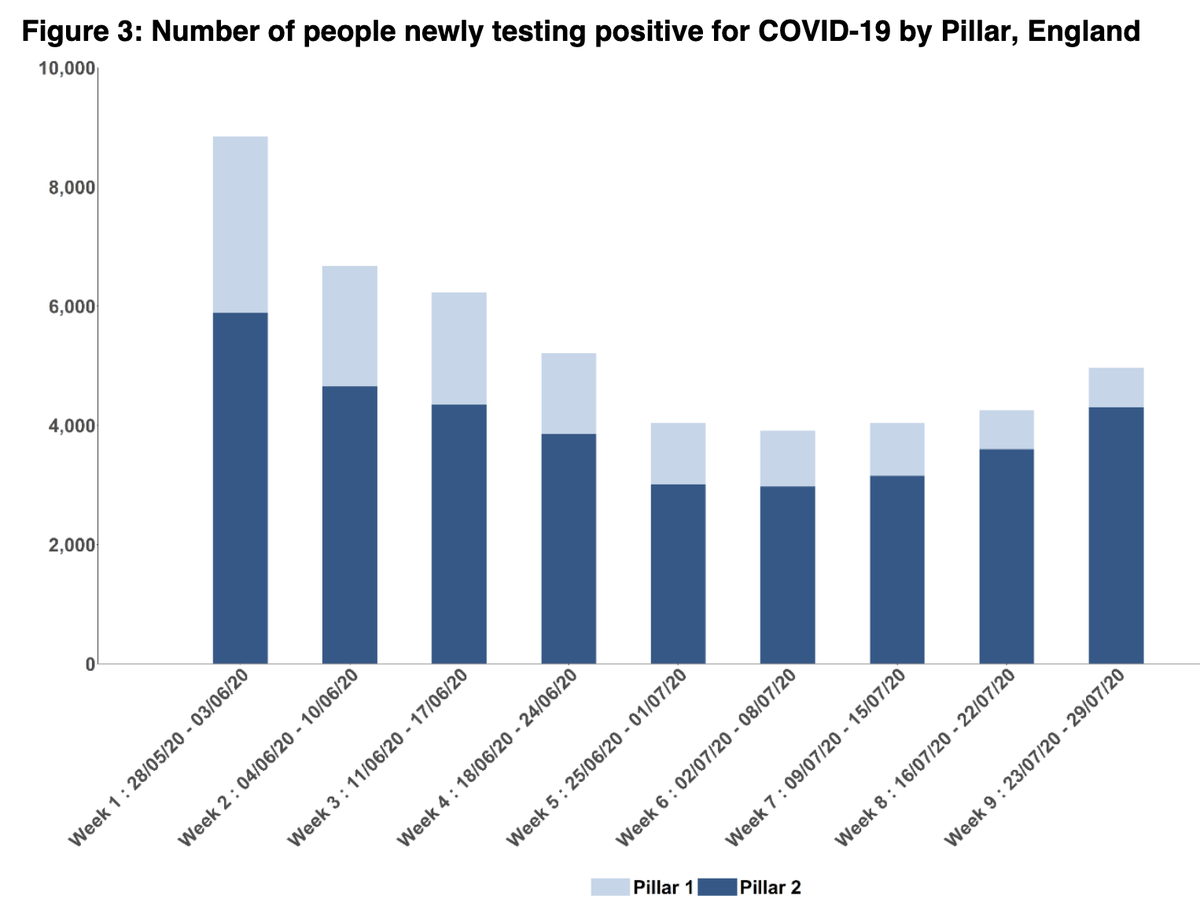
-Increase in cases three weeks in a row. V significant 17% increase on week 8 (4,966 vs 4,253).
For comparison, week 6 to 7 was a 3% rise in cases, and wk 7 to 8 was a 5% rise.
-Increase in cases three weeks in a row. V significant 17% increase on week 8 (4,966 vs 4,253).
For comparison, week 6 to 7 was a 3% rise in cases, and wk 7 to 8 was a 5% rise.
-The increase is from non-complex community cases. And it's not just because more tests are being done.
The % of pillar 2 tests that are positive has increased two weeks in a row from 1.35% in wk7, 1.48% in wk 8, to 1.66% in wk 9.
% positive in pillar 1 is the same (0.50%)
The % of pillar 2 tests that are positive has increased two weeks in a row from 1.35% in wk7, 1.48% in wk 8, to 1.66% in wk 9.
% positive in pillar 1 is the same (0.50%)
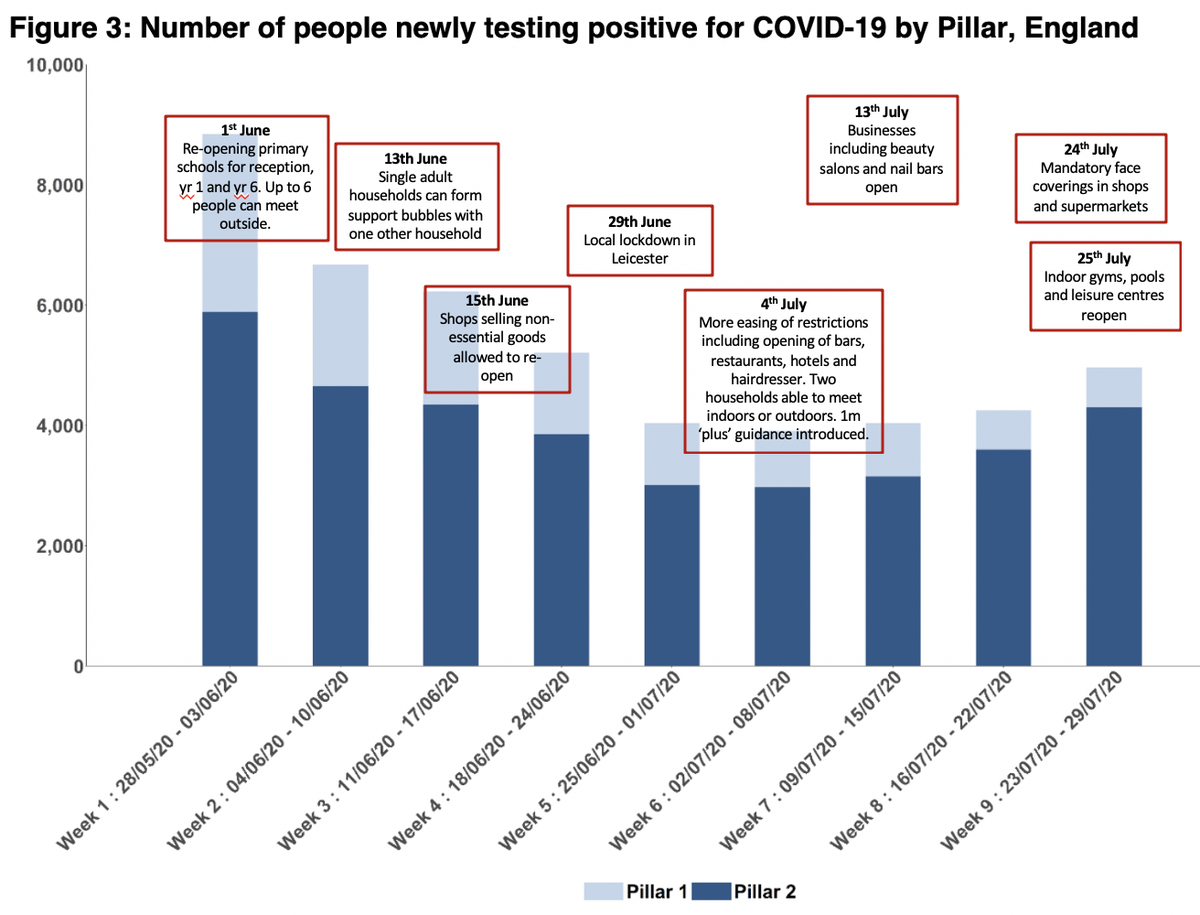
And with the 1-2 wk lag between being infected and developing symptoms/getting a test, the policy timeline is important.
We're now looking at cases approx 3 wks on from the major lifting of social restrictions on 4th July.
We're now looking at cases approx 3 wks on from the major lifting of social restrictions on 4th July.
-There is a small increase in number of complex cases, and it would be really helpful to know breakdown of these by setting (care home, hospital, workplace etc).
-for the first time since T&T started there was a decrease in the proportion of cases who gave details of contacts (82% to 79%)
-Slight drop in overall number of contacts, but this is driven entirely by complex cases.
-Overall contacts per case is 5.2, v similar to last week. And for non-complex cases it's increased from 3.3 to 3.6 contacts per case.
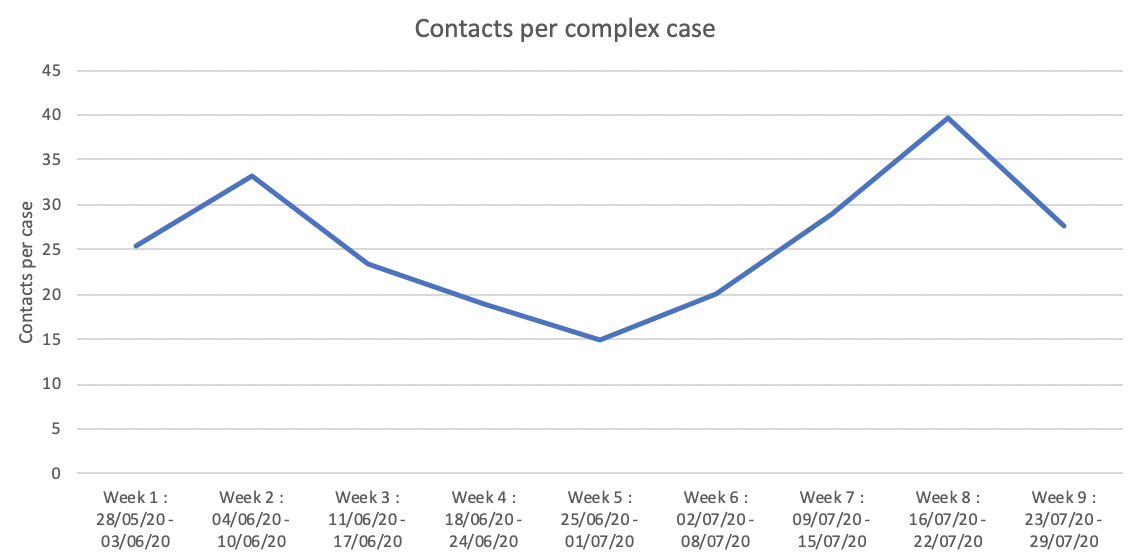
-but for complex, it's dropped from 39.6 to 25.6. Why?
-Overall contacts per case is 5.2, v similar to last week. And for non-complex cases it's increased from 3.3 to 3.6 contacts per case.
-but for complex, it's dropped from 39.6 to 25.6. Why?
The fluctuation in contacts per complex case is odd.
I don't know why - it may be genuine data fluctuations given relatively low case numbers, or something in data recording (practice has changed over time). Either way, it's hard to interpret.
(cf contacts per non-complex case)
I don't know why - it may be genuine data fluctuations given relatively low case numbers, or something in data recording (practice has changed over time). Either way, it's hard to interpret.
(cf contacts per non-complex case)
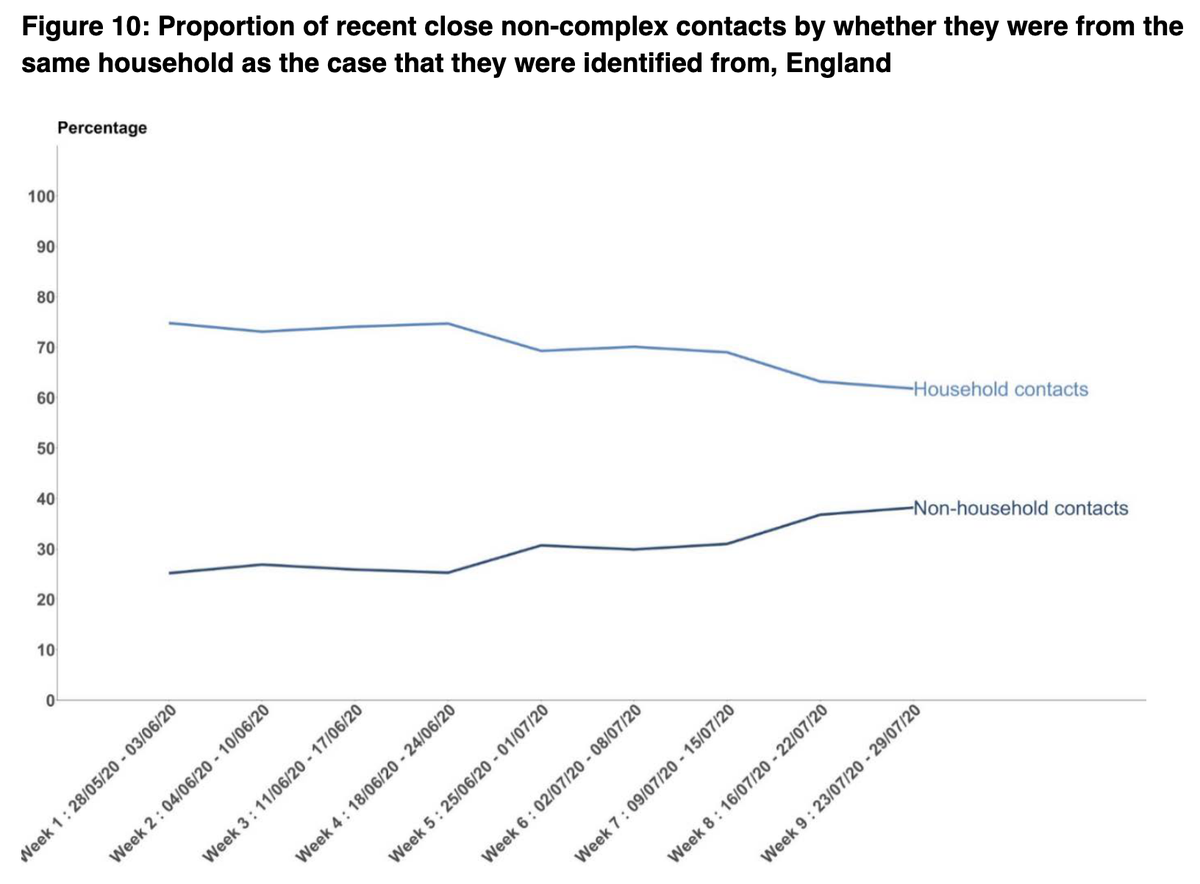
-62% of non-complex close contacts are household, similar to last week.
Fewer HH contacts are reached than non-HH. Gov says cause cases will just tell their household. This makes overall contacts reached v hard to interpret, surely they should be included as a contact reached?
Fewer HH contacts are reached than non-HH. Gov says cause cases will just tell their household. This makes overall contacts reached v hard to interpret, surely they should be included as a contact reached?
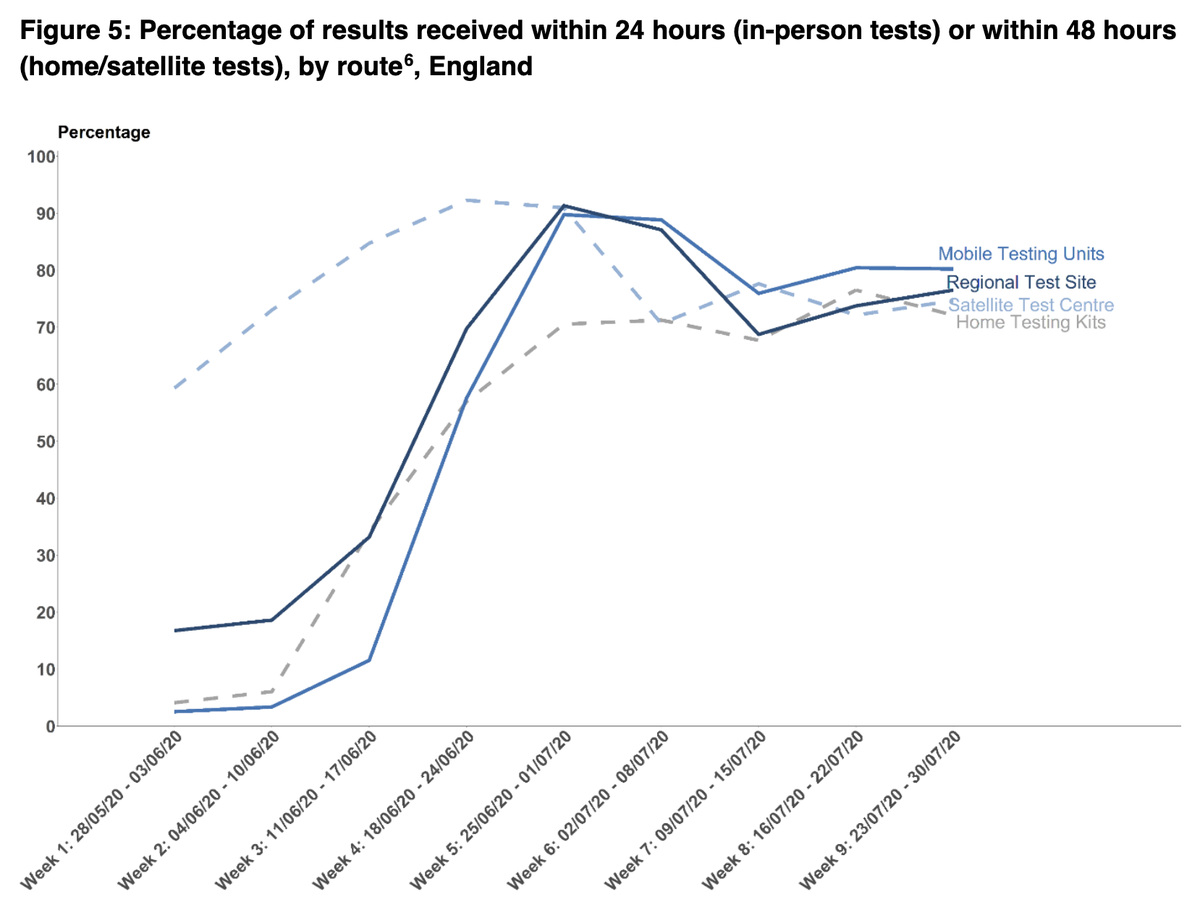
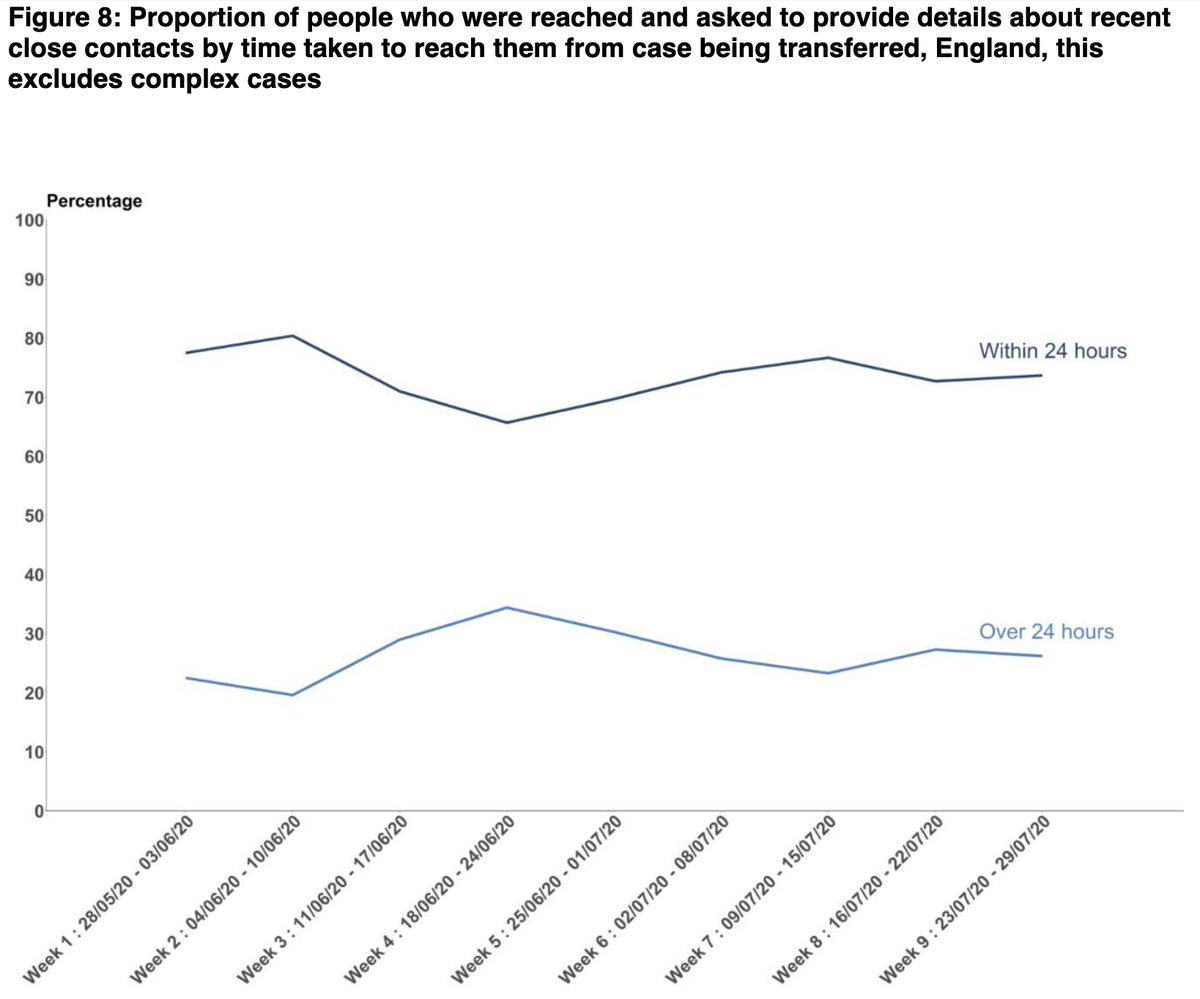
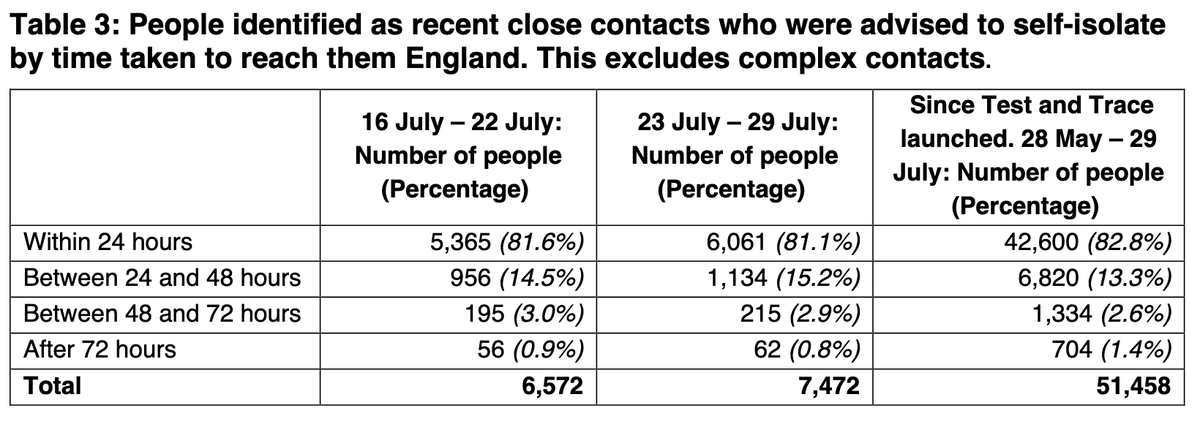
-Test time from request to result, for T&T to reach case, and then to reach contacts all roughly same as last week. And def not improving.
So overall, a very significant jump in cases.
And a rise 3 weeks in a row.
And daily UK case rates suggest this will continue for wk 10 of T&T as EVERY DAY b/w 30/7 and 6/8 there were more UK cases than the week before (104 more today than last thurs).
https://coronavirus.data.gov.uk/cases
And a rise 3 weeks in a row.
And daily UK case rates suggest this will continue for wk 10 of T&T as EVERY DAY b/w 30/7 and 6/8 there were more UK cases than the week before (104 more today than last thurs).
https://coronavirus.data.gov.uk/cases
This is concerning but hasn't yet translated to hospital use/deaths.
This may be due to delay b/w infection and severe symptoms.
It may be due to less clinically vulnerable pop being infected.
It may be due to different type of exposure.
It may be all of this/something else.
This may be due to delay b/w infection and severe symptoms.
It may be due to less clinically vulnerable pop being infected.
It may be due to different type of exposure.
It may be all of this/something else.
And to go back to three points I made earlier in the week:
-Contact tracing is hard, but can def be better, incl. with real-time data sharing b/w T&T, PHE, and local gov.
-Contact tracing is hard, but can def be better, incl. with real-time data sharing b/w T&T, PHE, and local gov.
-PHE health protection teams & local gov have been working together to effectively and efficiently manage disease outbreaks for years. They just need to the data AND resources to get on with it. Getting rid of PHE is not part of any quick fix solution.
-Those who NHS T&T struggle to reach may be more likely to be those w/o phones or the internet: more deprived, more elderly, more vulnerable.
These are the very people local gov public health teams work hardest to reach. /end
These are the very people local gov public health teams work hardest to reach. /end

 Read on Twitter
