A long since since I did one of these... time for a BTC macro cycle update, starring on-chain and network data!
With the current break to 11k, I'm relatively confident last months model is working on queue, we're at the start of the "main bull phase". https://twitter.com/woonomic/status/1276840377991827457?s=20
With the current break to 11k, I'm relatively confident last months model is working on queue, we're at the start of the "main bull phase". https://twitter.com/woonomic/status/1276840377991827457?s=20
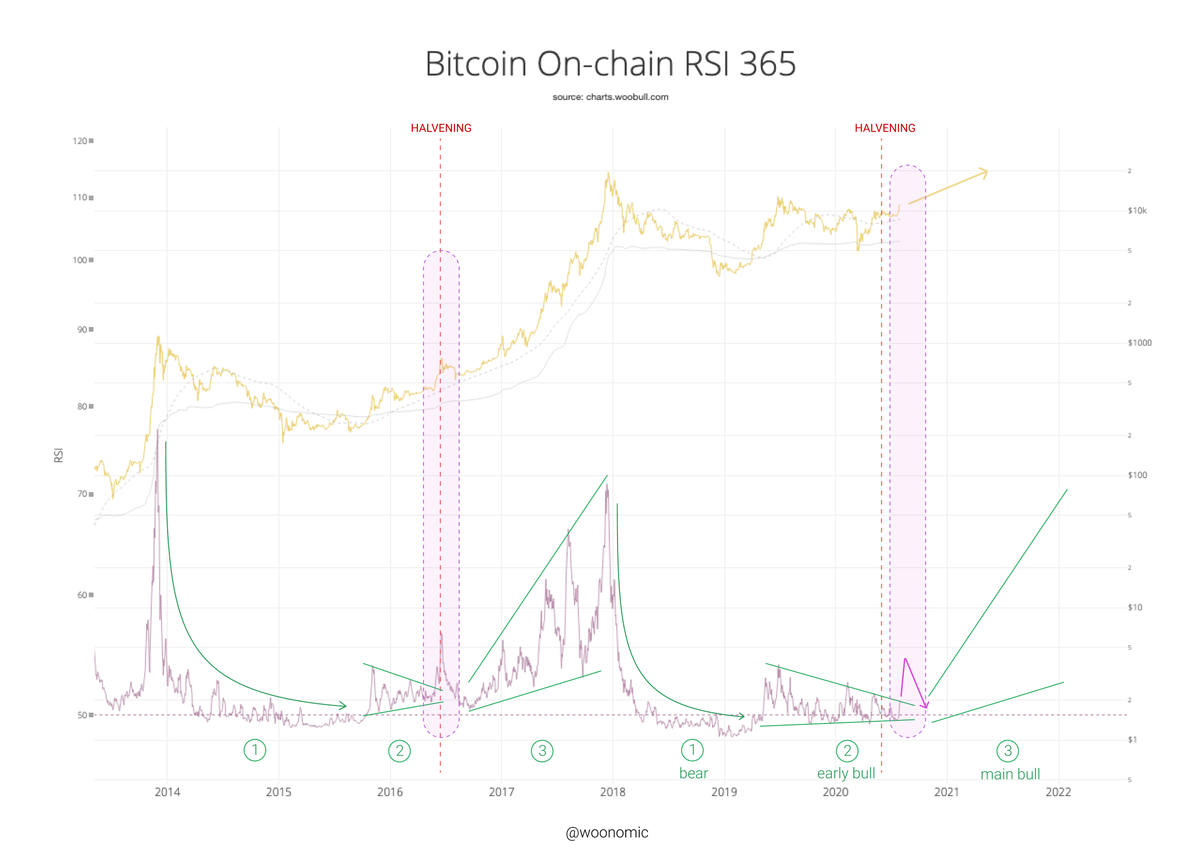
365 day on-chain RSI (private chart not yet publicly available) shows the compression at the early phase of the bull cycle nearing completion, I'm expecting RSI expansion that typifies the main bull season run starting Q4 2020 into 2021. ("main bull phase" labeled in the chart)
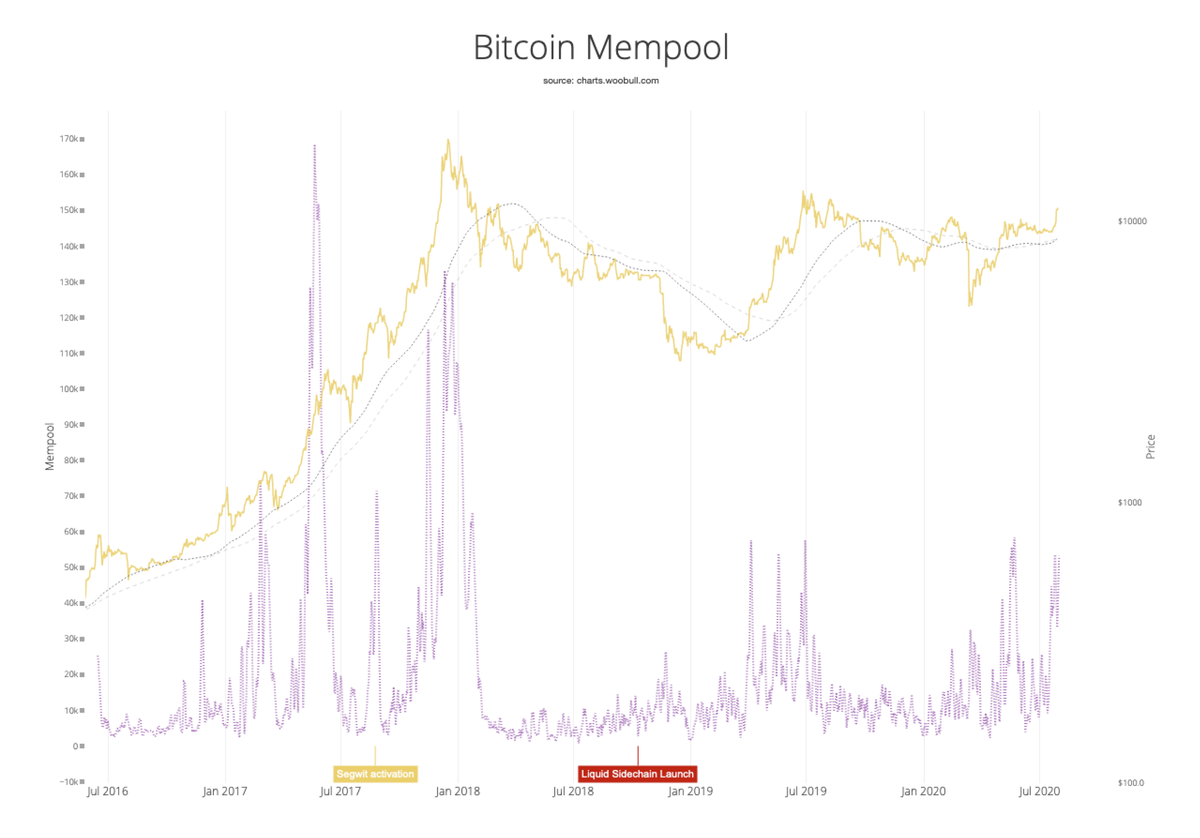
The mempool, i.e. the network queue for unprocessed transactions, is spiking back into bullish territory. This chart tracks memory usage, mempool by transaction count is in fact at an all time high for this macro cycle.
Here's another view of it, blocks are also filled to an all time high. We've seen some congestion at peak trading days, this is very bullish.
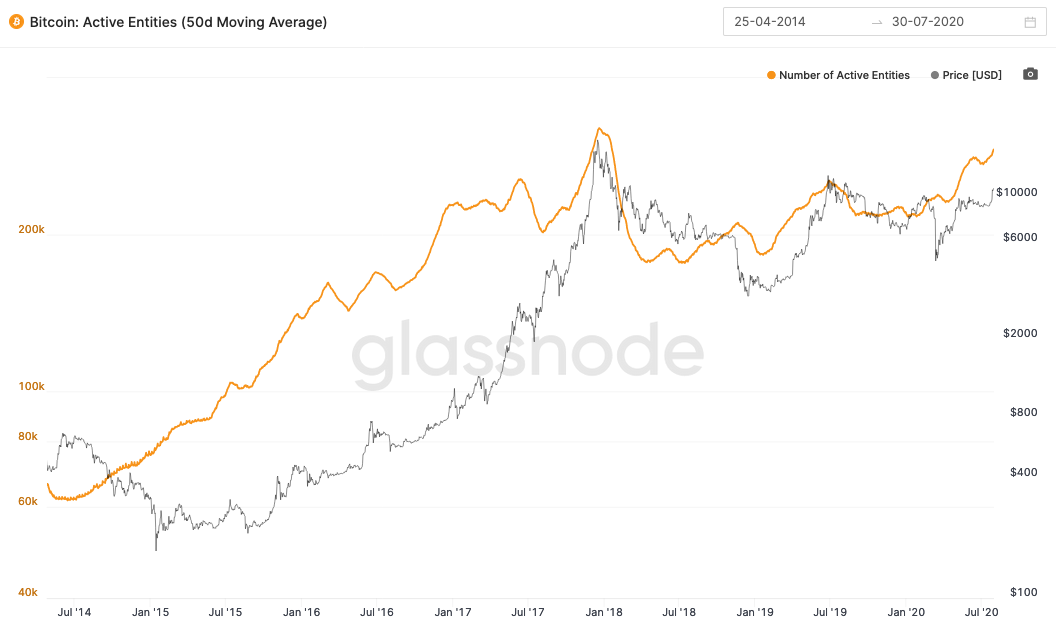
Active entities, that is to say active individuals or organisations determined by on-chain forensic clustering by @glassnode, is nearing all times highs last seen in the 2017 peak.
Nearly 95% of bitcoins (UXTOs) in wallets are in profit, and still climbing. We typically see this red-line in the main part of the bull run to the top. Nearly there. Data by @glassnode
Miners difficulty ribbon is in compression recovery, a very reliable bullish indicator. This chart shows again where we are in the macro cycle.
Ribbon compression signals miner capitulation and strong miner HODLing thereafter. Red verticals are halvening dates.
Ribbon compression signals miner capitulation and strong miner HODLing thereafter. Red verticals are halvening dates.
Final chart, another view of the macro cycle in terms of the price oscillation between my Top Cap and Bottom Models (Cumulative Value Days Destroyed).
Some live charts on http://charts.woobull.com
On-chain and network data kindly provided by @coinmetrics and @glassnode
This analysis supported by LVL, we're building bitcoin banking services for US customers, get the app along with $10 of free BTC here http://lvl.co/woo
On-chain and network data kindly provided by @coinmetrics and @glassnode
This analysis supported by LVL, we're building bitcoin banking services for US customers, get the app along with $10 of free BTC here http://lvl.co/woo

 Read on Twitter


