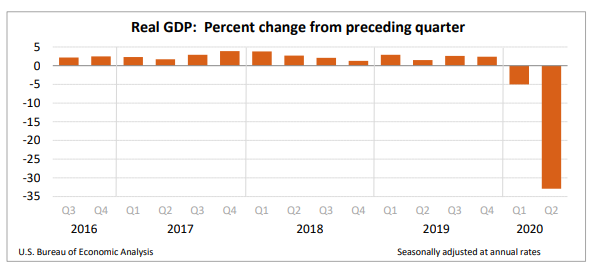
GDP fell 32.9% last quarter (Q2: Apr, May, June) at an annual rate, the biggest decline on record with data back to the 1940s. That's an awful number, but it's also a uniquely old number. This is a tricky report--read on, if you dare...
"Annual" means -33% would be GDPs pace of decline for a year if this same pace persisted for 4 quarters. But we know that didn't happen. The jobs data tell us that the Q2 damage was done in April due to the shutdown. As commerce returned, May/June were stronger.
Data from the report show what happened: When you put consumers on lockdown in a 70% consumer-spending economy, you go off a cliff: spending was down a record 34.6%, annualized. Investment fell by half!
Now, even with the current slowdown, most forecasters expect Q3 to be a big positive. But that's dated too: May & June reflect a (too-early) reopening that partially reversed in July. So, here, IMHO, are the punchlines (4&5 are the biggies):
1) Today's numbers confirm the deepest recession since the Great Depression--deeper, even, though much shorter.
2) But to track the current economy, we need more timely numbers: job gains/losses most revealing.
3a) They show an economy still w recessionary conditions...
2) But to track the current economy, we need more timely numbers: job gains/losses most revealing.
3a) They show an economy still w recessionary conditions...
3b) Unemp Ins data, also out this AM show 30 million people with total claims, off the charts. Official unemp rate 11% higher than worst of last recession.
4) Whatever GDP #'s say, fact is failure to control the virus means it still feels like a recession to many out there...
4) Whatever GDP #'s say, fact is failure to control the virus means it still feels like a recession to many out there...
5) Which means allowing enhanced UI benefits to expire tomorrow is unforgivable malpractice by Congressional R's. Which isn't surprising as the virus has exposed what was there all the time: they don't govern. https://www.washingtonpost.com/outlook/2020/07/30/unemployment-insurance-problem-is-microcosm-much-bigger-problem/

 Read on Twitter


