So I promised more behind-the-scenes of the @FiveThirtyEight 2020 forecast. Today I'll walk you through the development of our topline chart! 
That is specifically: the chart that shows the chances of a candidate winning the election in November.

That is specifically: the chart that shows the chances of a candidate winning the election in November.
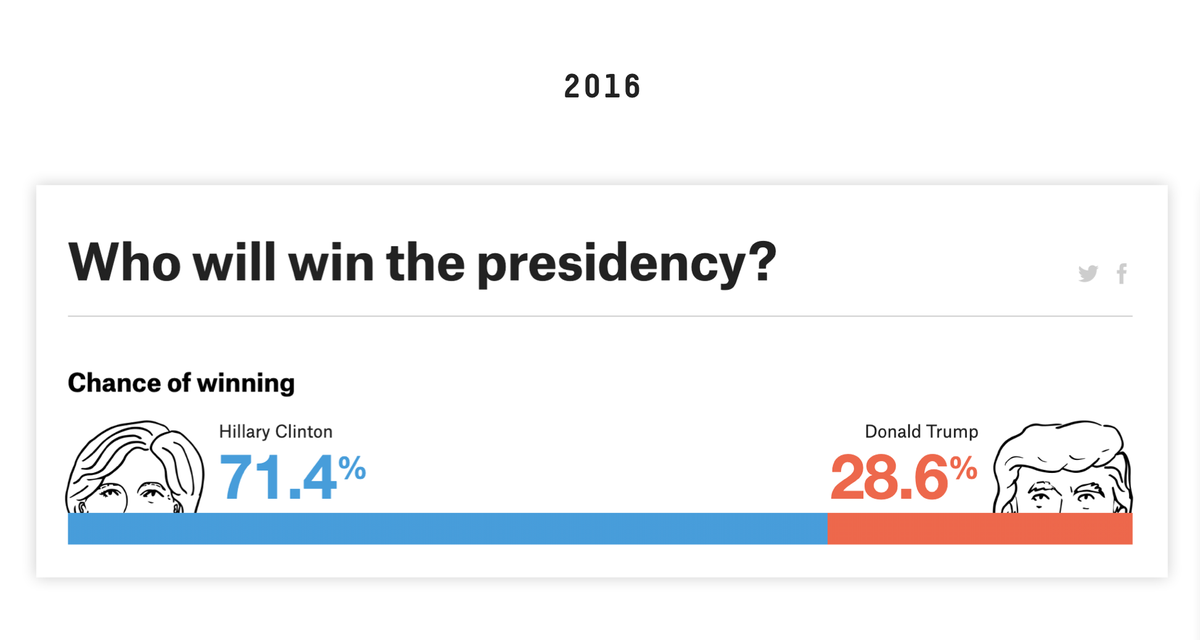
2016 is past, right? Bc what we made perhaps oversimplified what we're showing in the forecast odds. 2016 topline is what allows ppl to heckle me in bars when I say I work for FTE (didn't you guys f up 2016?)
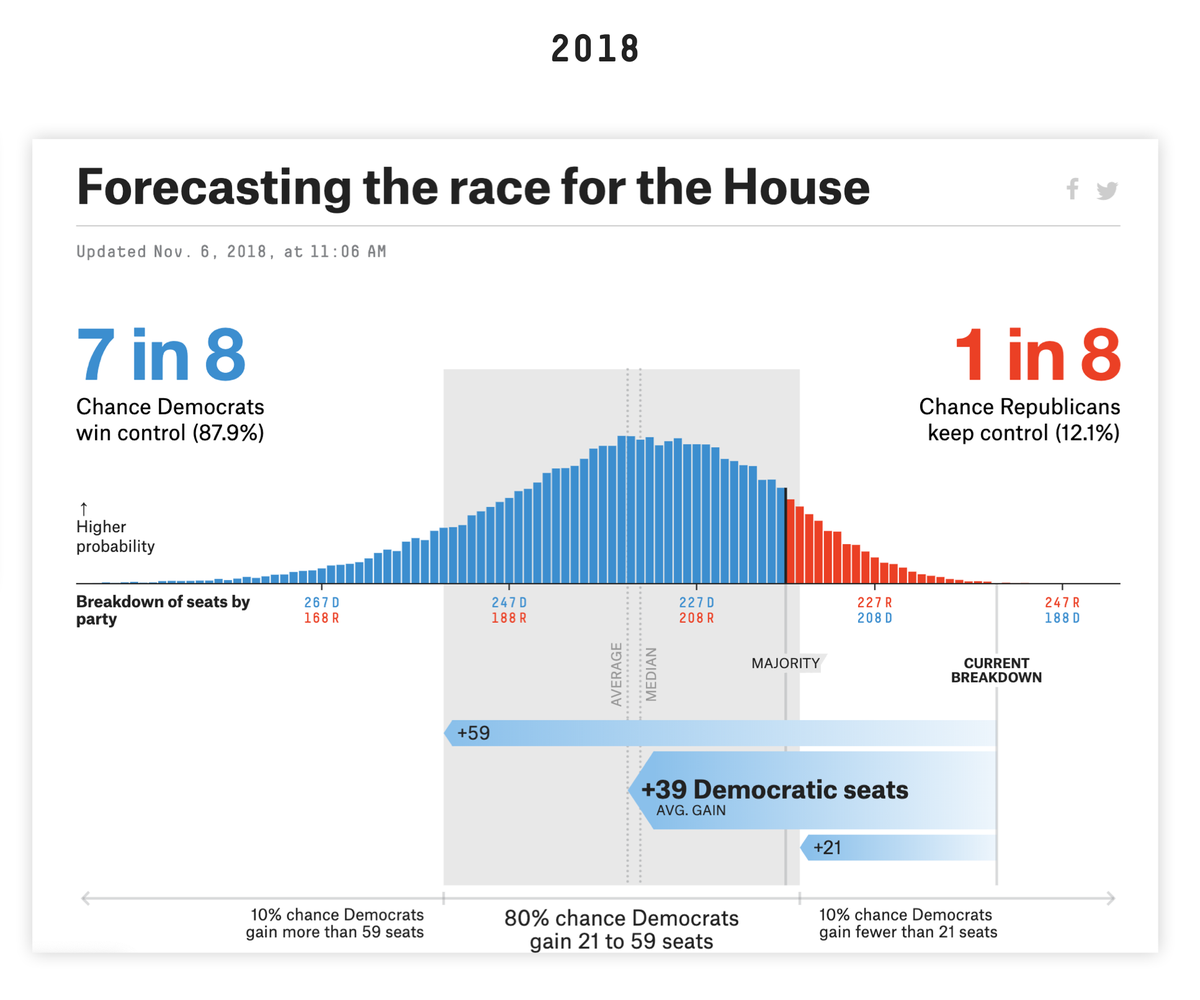
Anyway, some could say we overcorrected in 2018 w this complexity:
Anyway, some could say we overcorrected in 2018 w this complexity:
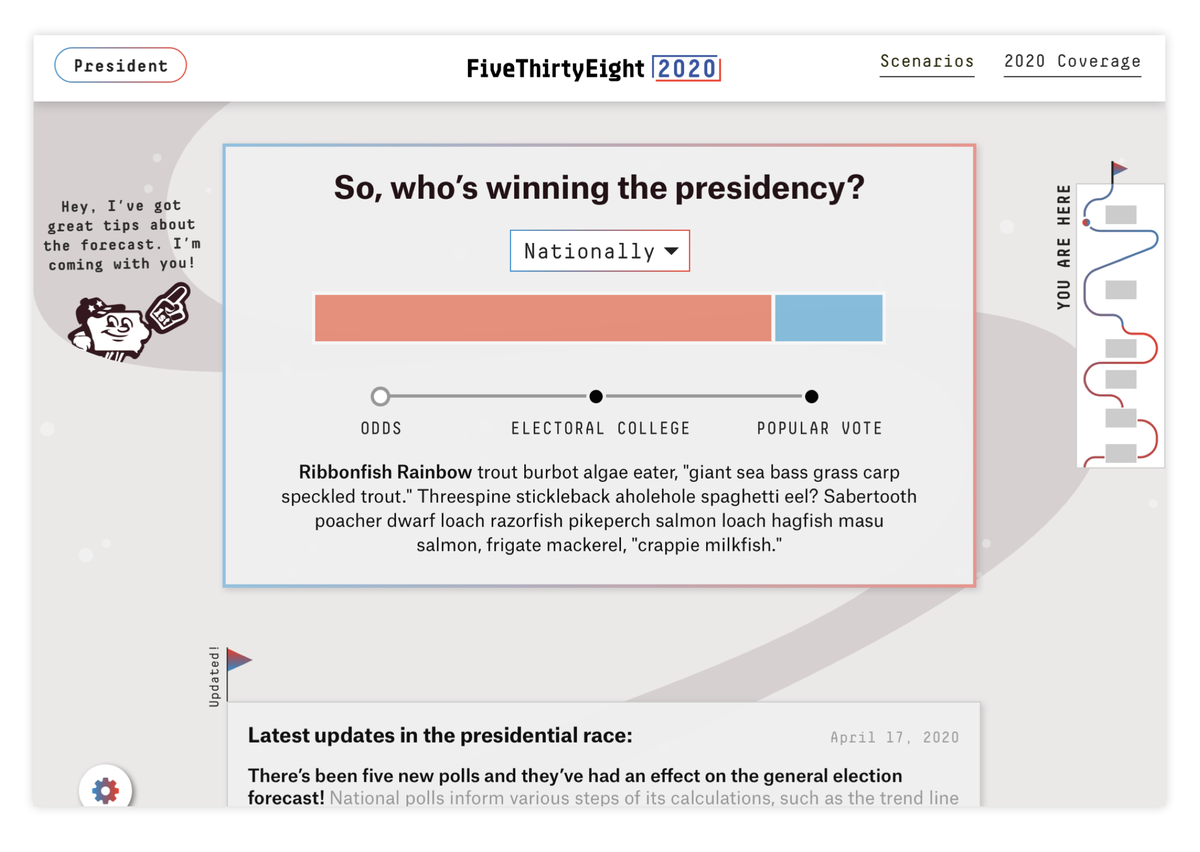
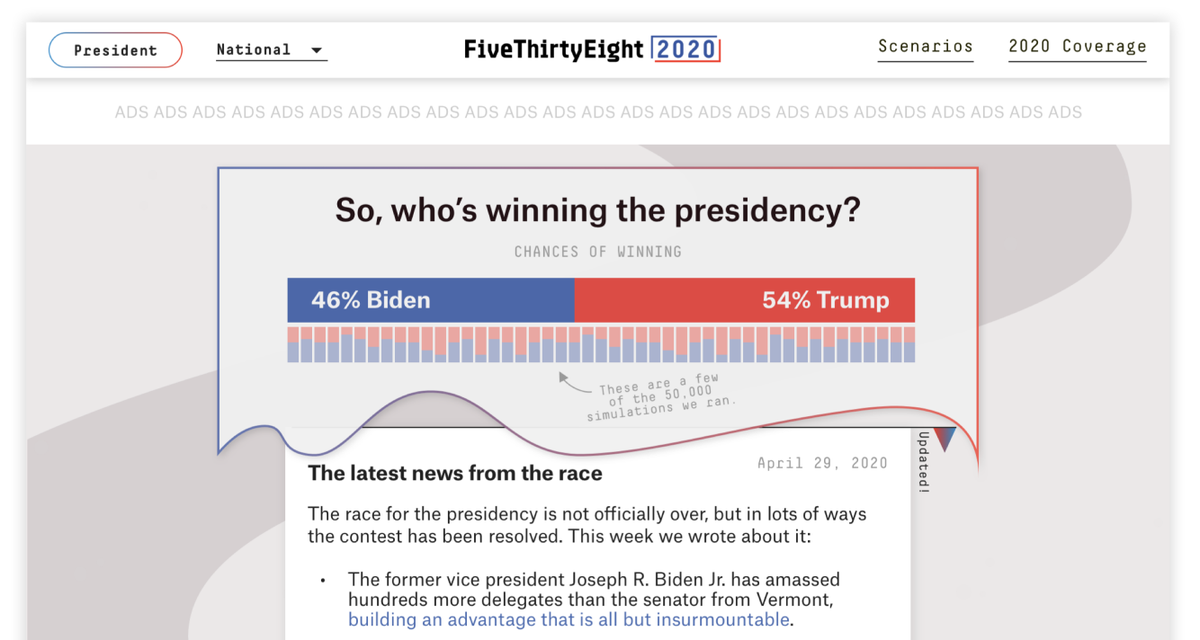
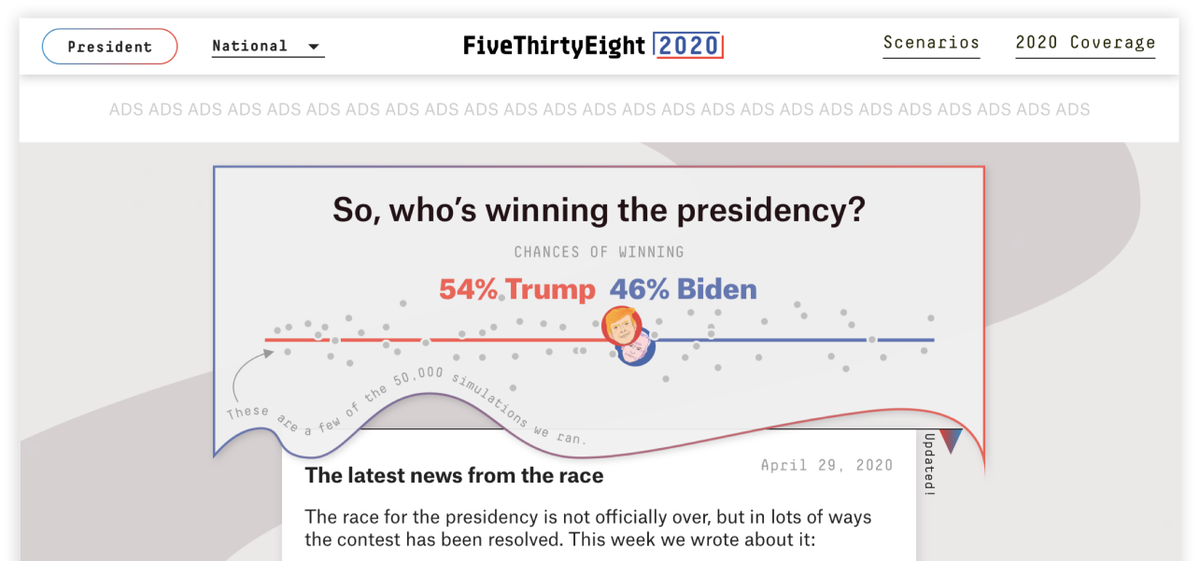
We started out 2020 mocks with that same bar chart, hoping we could still achieve simplicity above the scroll. And, that a way to explain what goes INTO that chart would accompany it.
The bar chart is only part the story when thinking about how the election could shake out.
The bar chart is only part the story when thinking about how the election could shake out.

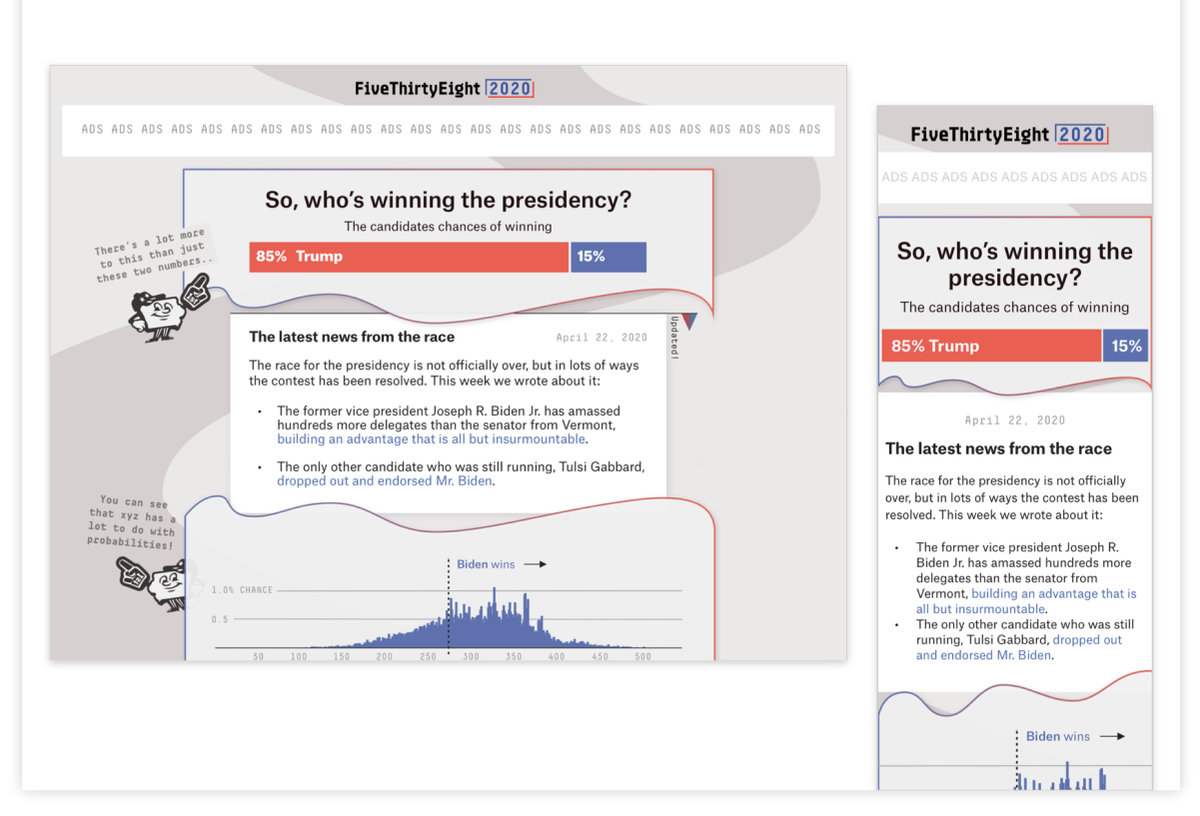
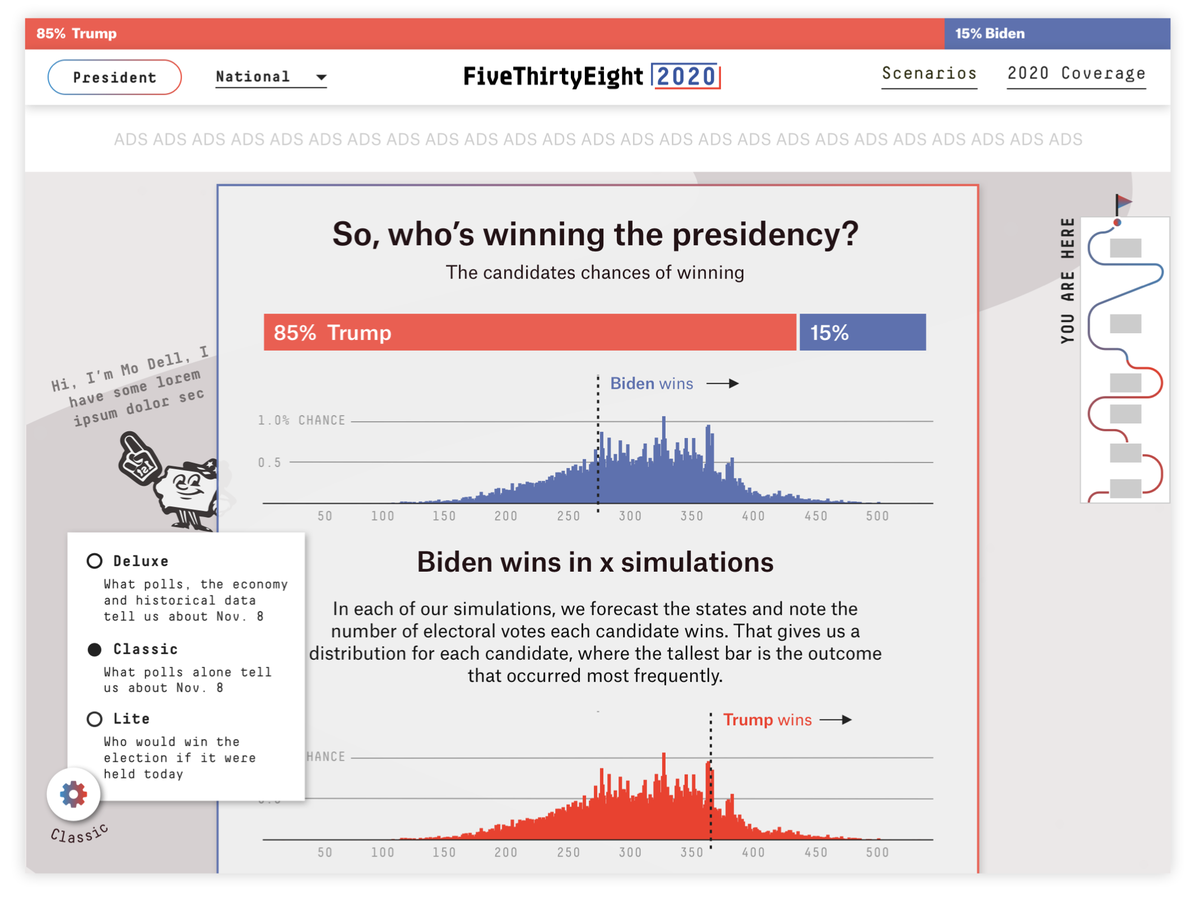
Combining 2016 (bar chart lead) and 2018 (histogram lead) was an obvious first step. We tried some  creative web design
  to split the page to show viz + editorial context or to have a sticky bar so odds follow you wherever you go!
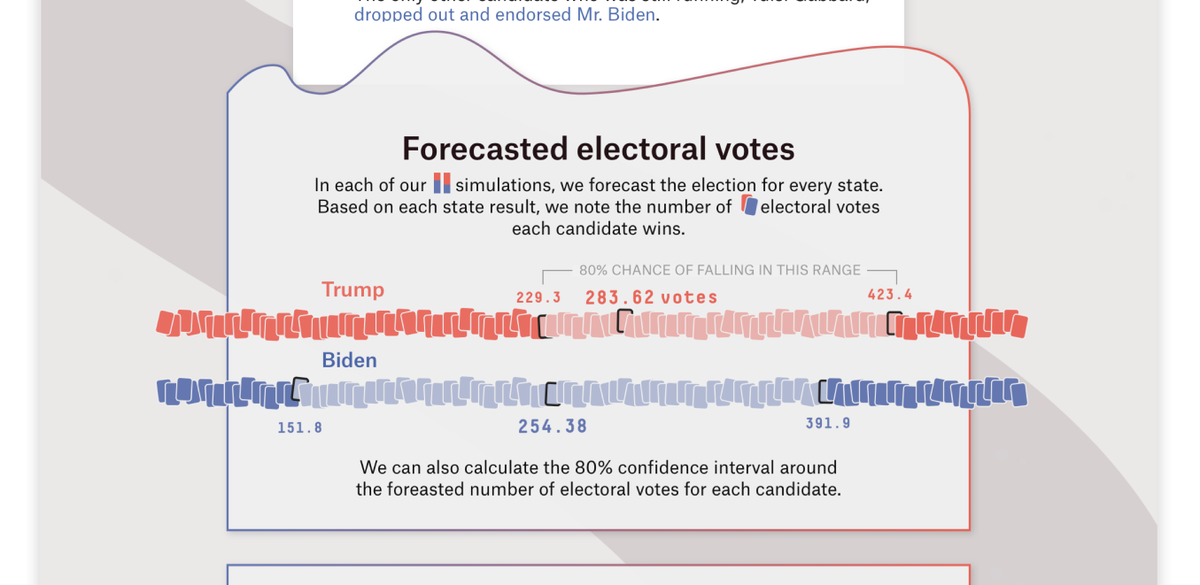
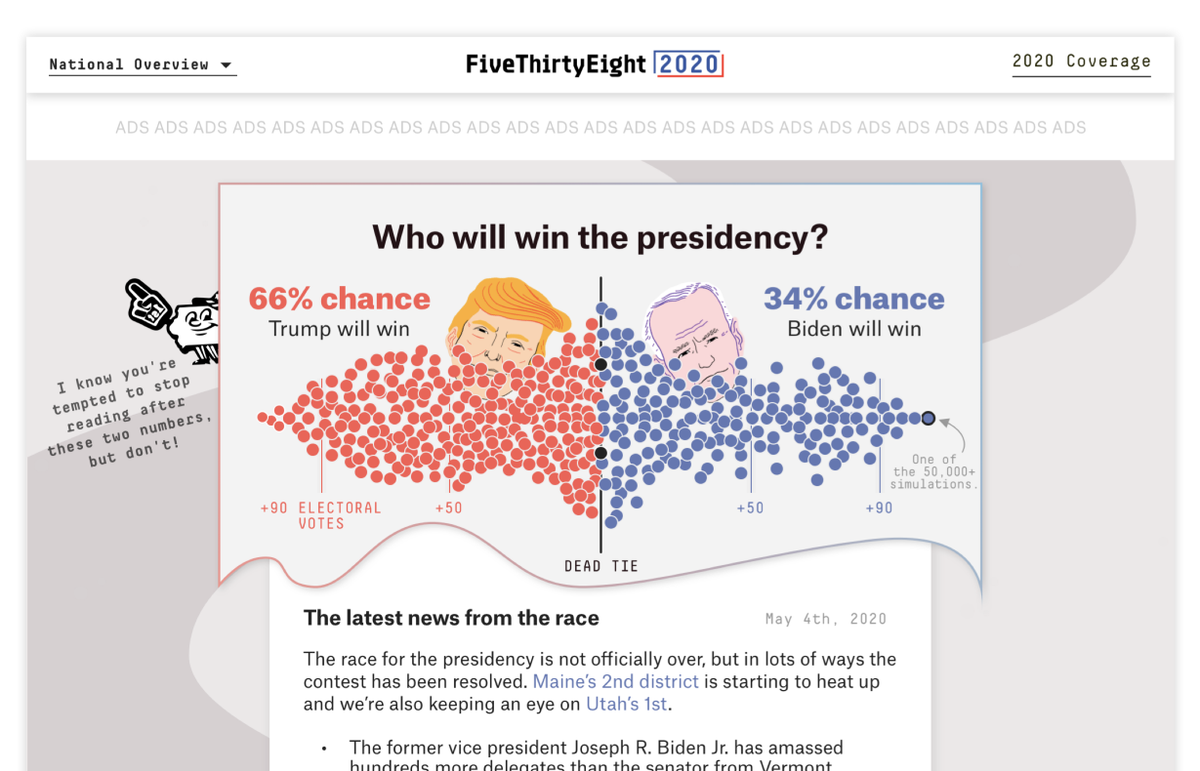
Still, uncertainty was missing.
 creative web design
  to split the page to show viz + editorial context or to have a sticky bar so odds follow you wherever you go!
Still, uncertainty was missing.

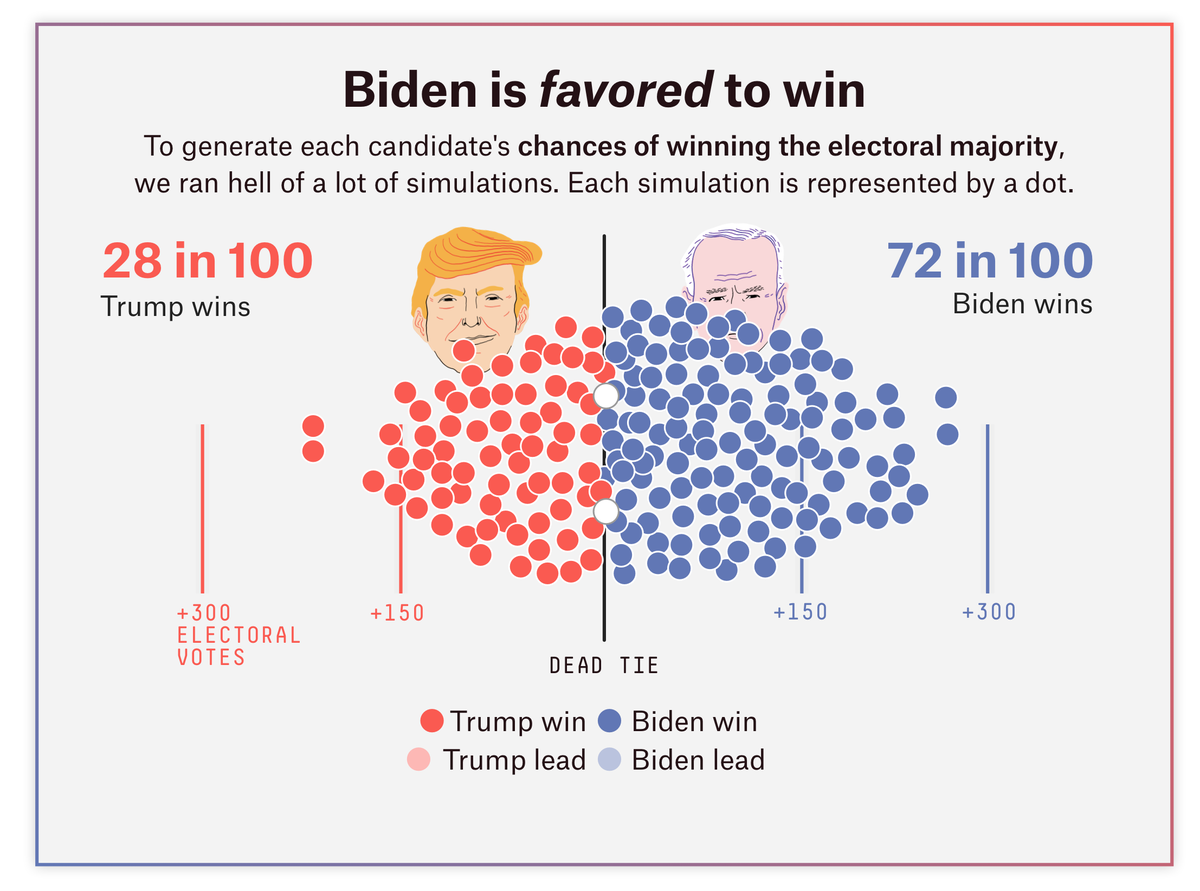
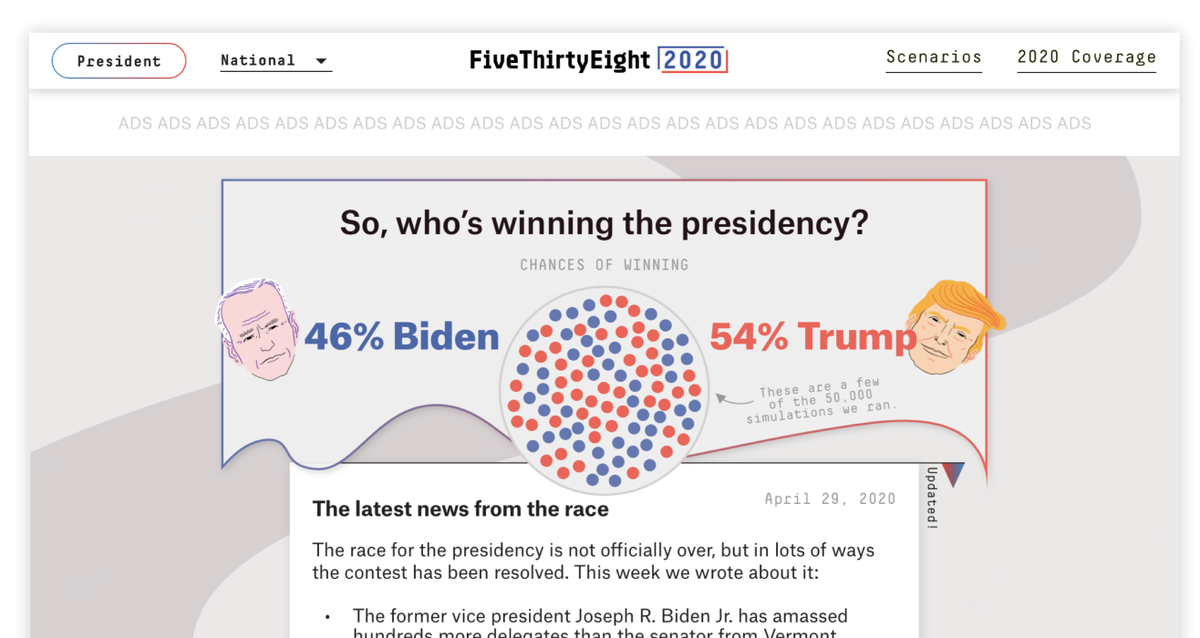
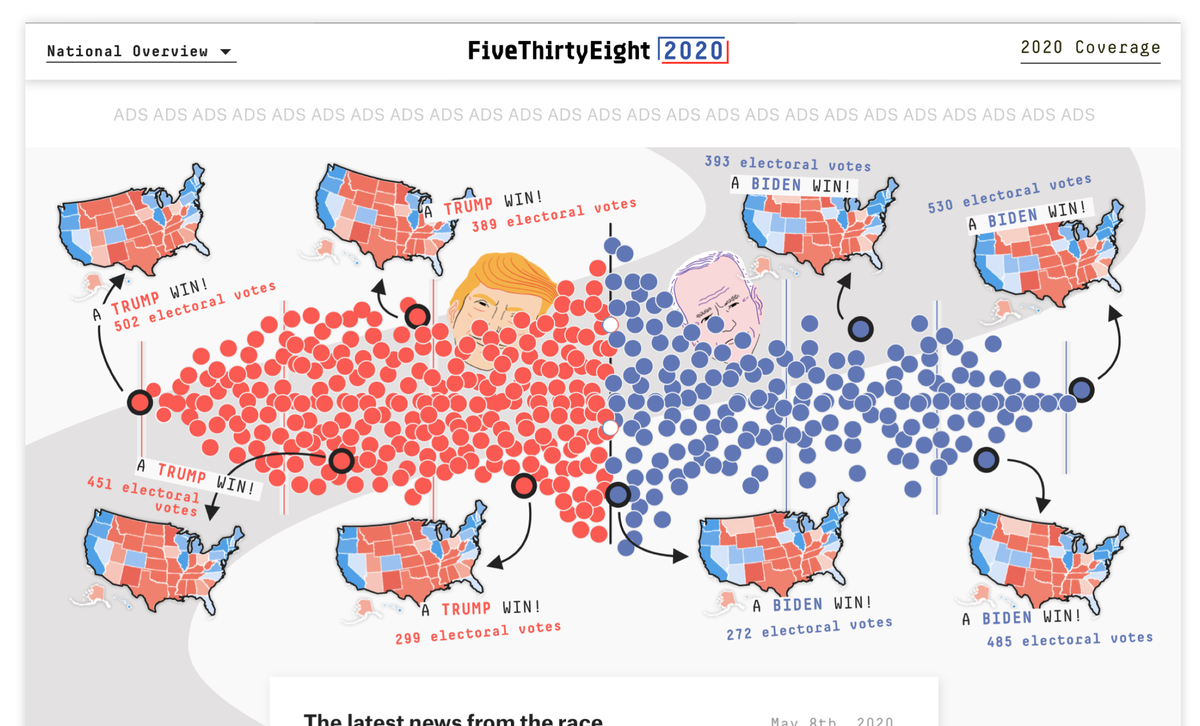
We iterated topline into oblivion (bc lol, remember 2016?) and eventually we landed on what we affectionally call Ballswarm™ 

 .
.
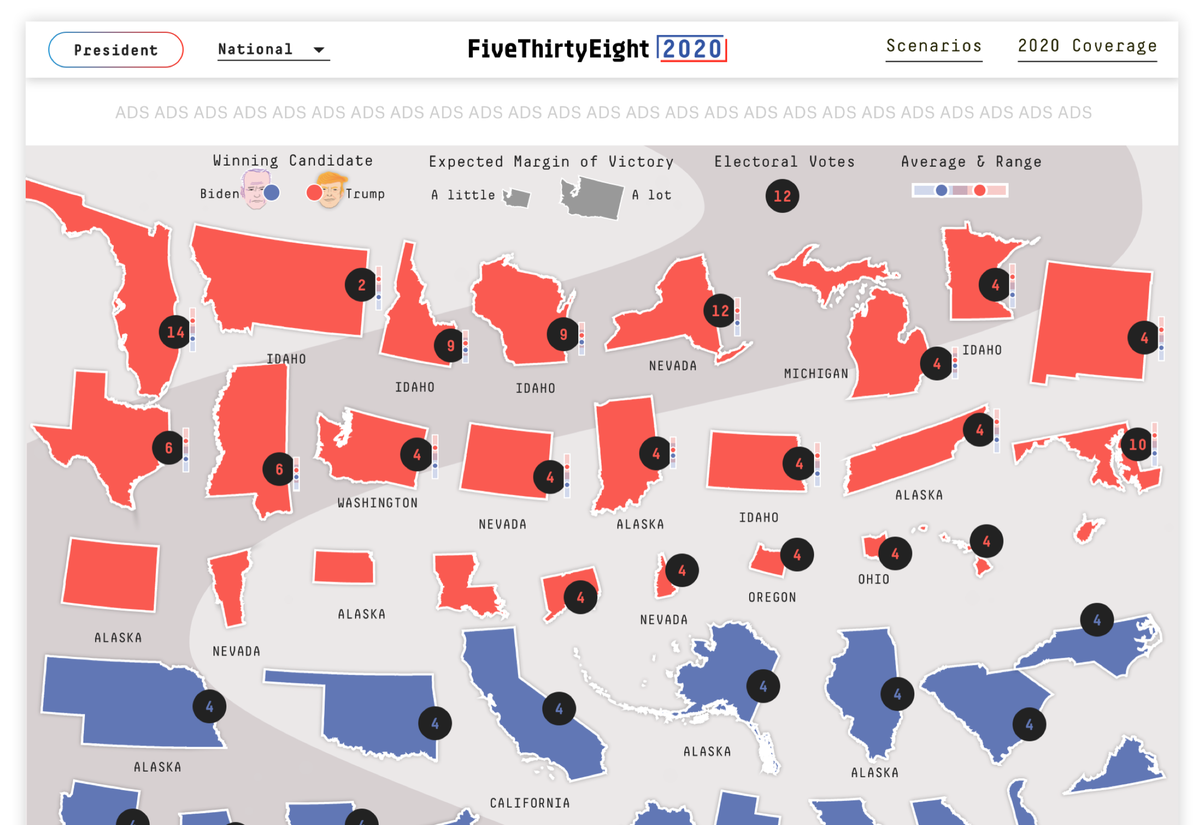
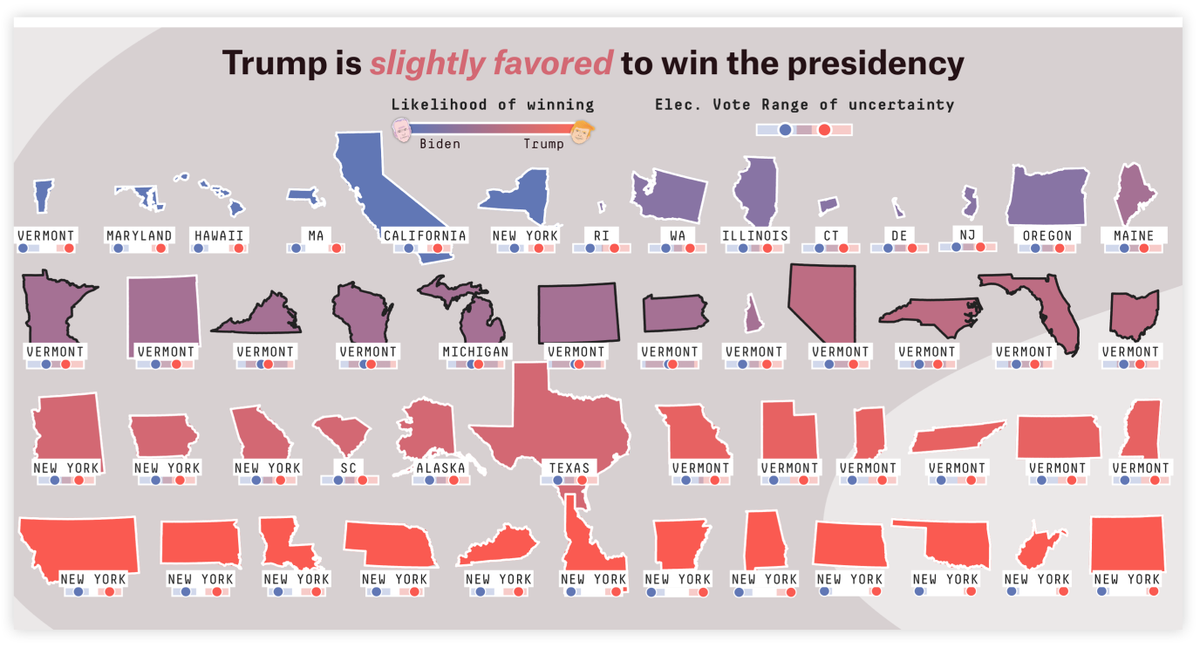
But there was still a rumbling for maps in the group.
 There
There must
must be
be maps!!!!!


 .
. But there was still a rumbling for maps in the group.
 There
There must
must be
be maps!!!!!
The desire for maps was unquenchable.
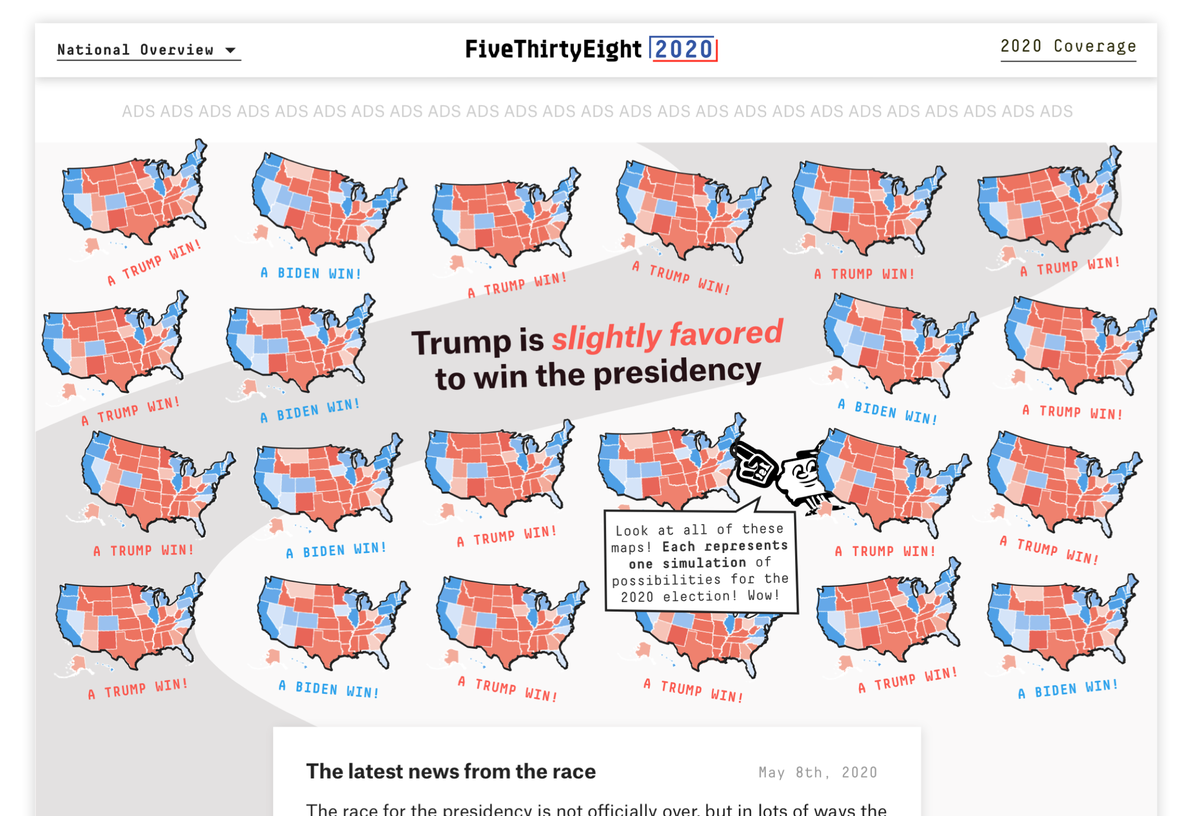
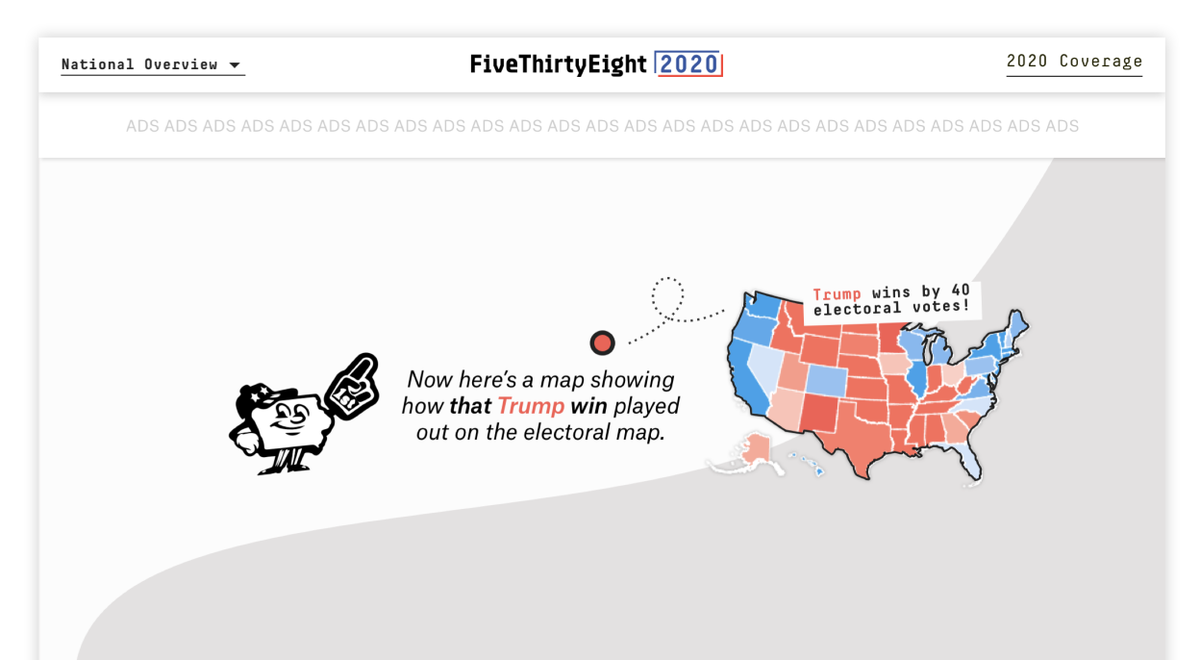
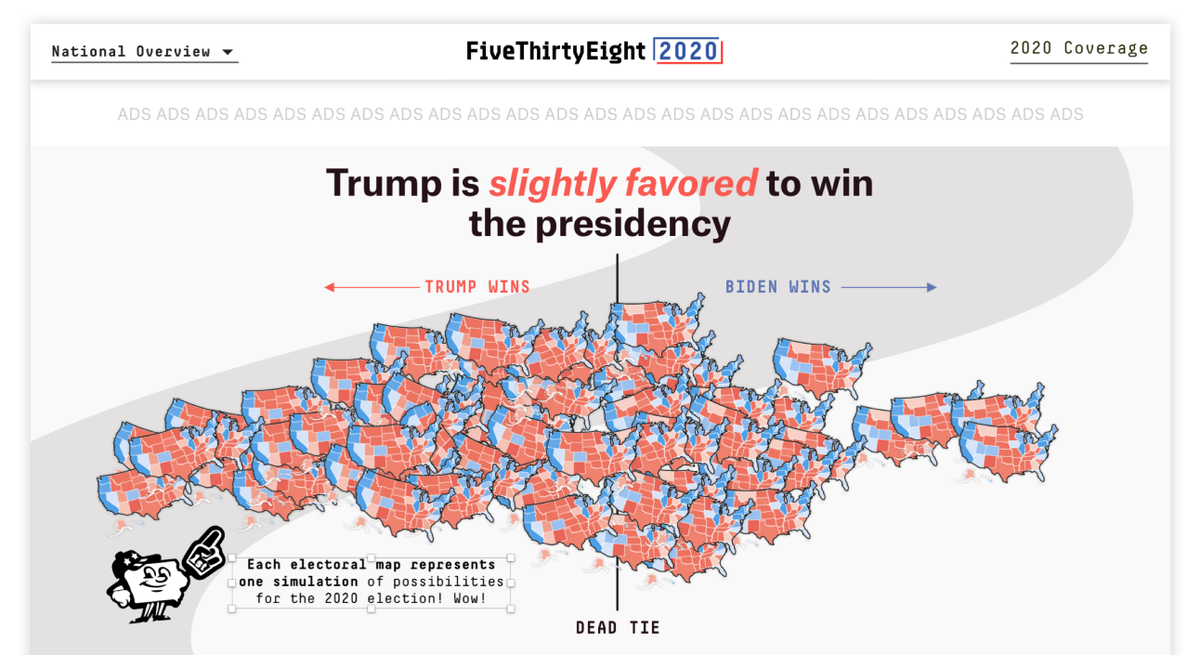
We pondered philosophically: what if we created a universe of maps?
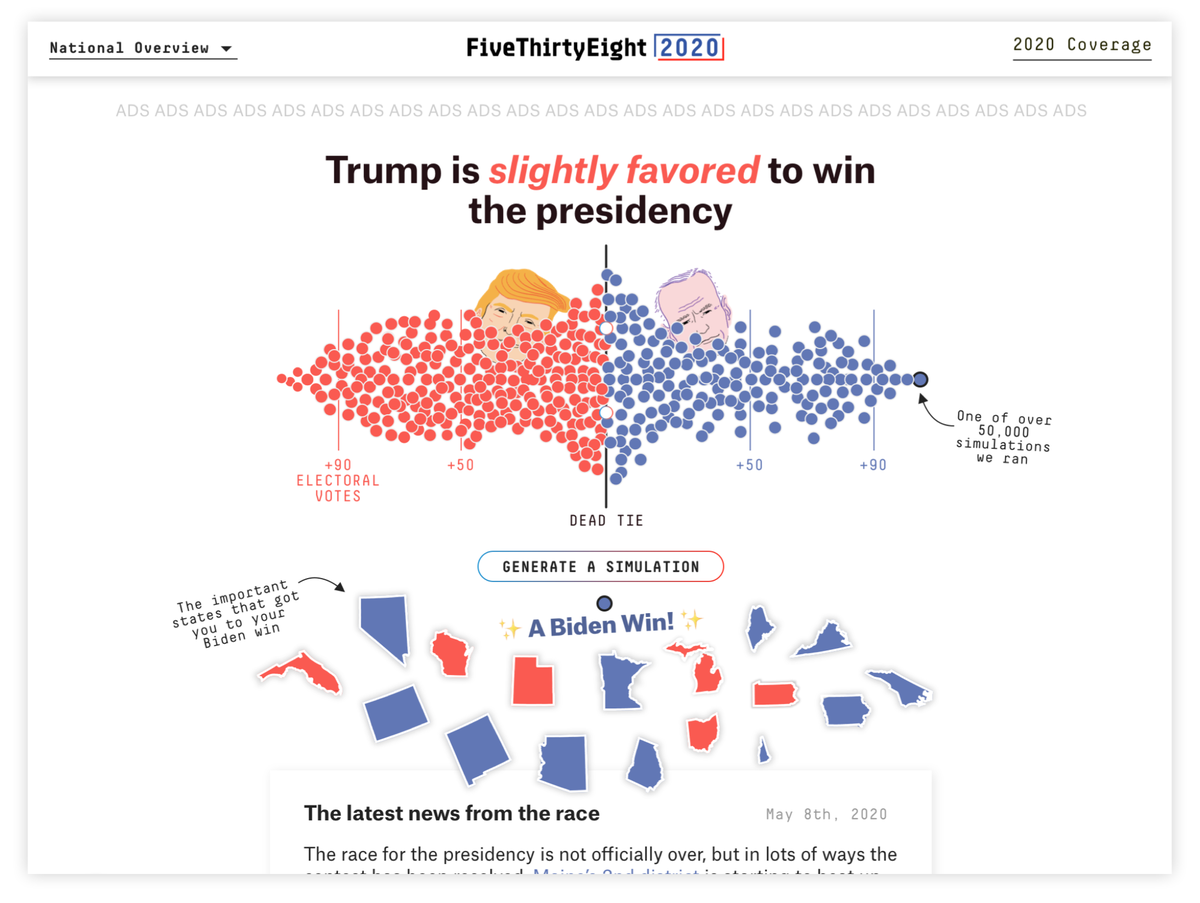
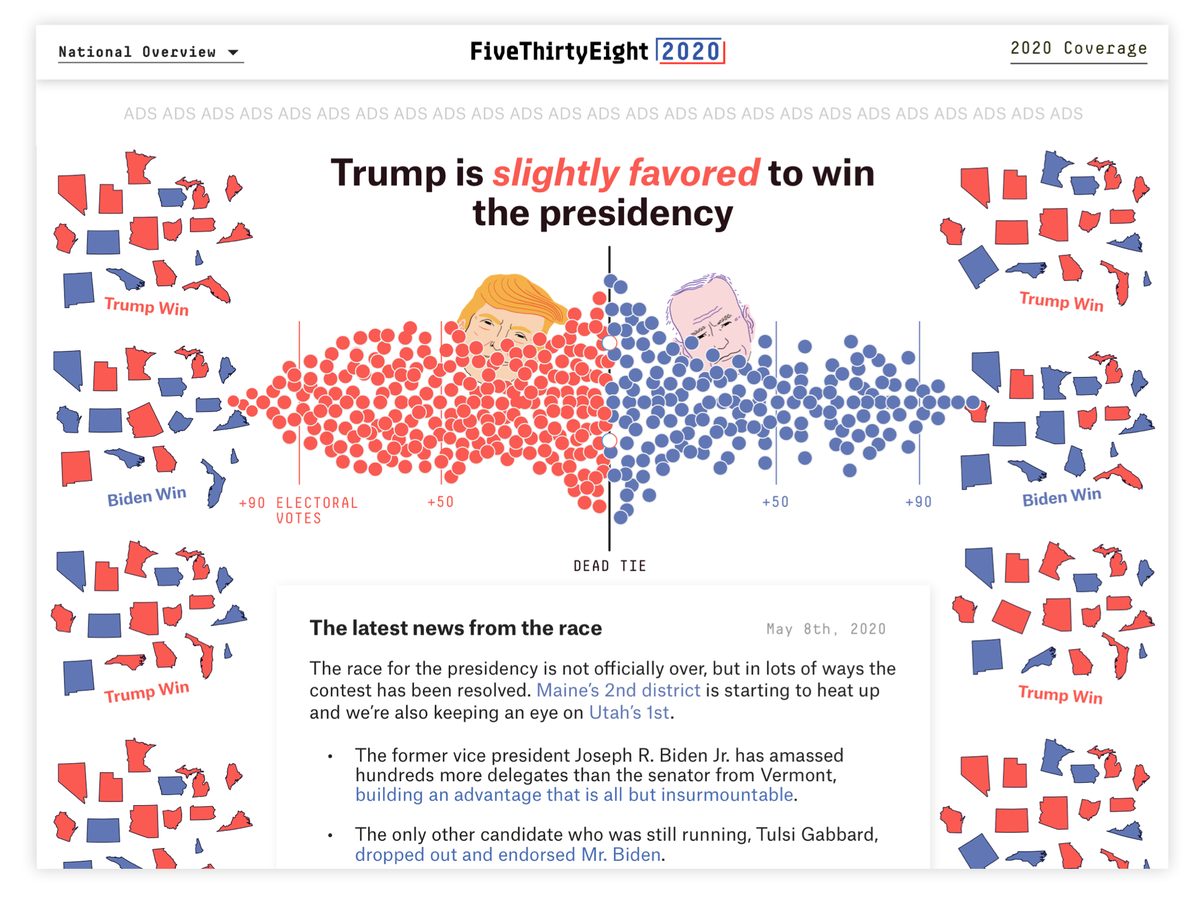
(BTW these maps each showed a forecasted electoral college outcome. By showing many maps, we might be able to convey how many possibilities there are!)
We pondered philosophically: what if we created a
 universe of maps?
(BTW these maps each showed a forecasted electoral college outcome. By showing many maps, we might be able to convey how many possibilities there are!)
We made UniverseSwarm™ and we even entertained an animated walkthrough to explain what...in the hell we were doing.
Further attempts of UniverseSwarm™ mashup until maps were imprinted on the inside of my eyelids. 
Until we finally thought: maybe we can't kill two birds with one stone? We can't show odds drowning readers in seas of universes of maps.

Until we finally thought: maybe we can't kill two birds with one stone? We can't show odds drowning readers in seas of universes of maps.


 Read on Twitter



 :
:




 FAKE DATA throughout this thread!)
