Hi #Nashville: Last week, we anticipated a possible shift in #coronavirus trends.
Today, there is some evidence that increased adherence to mask wearing , etc. may be paying off.
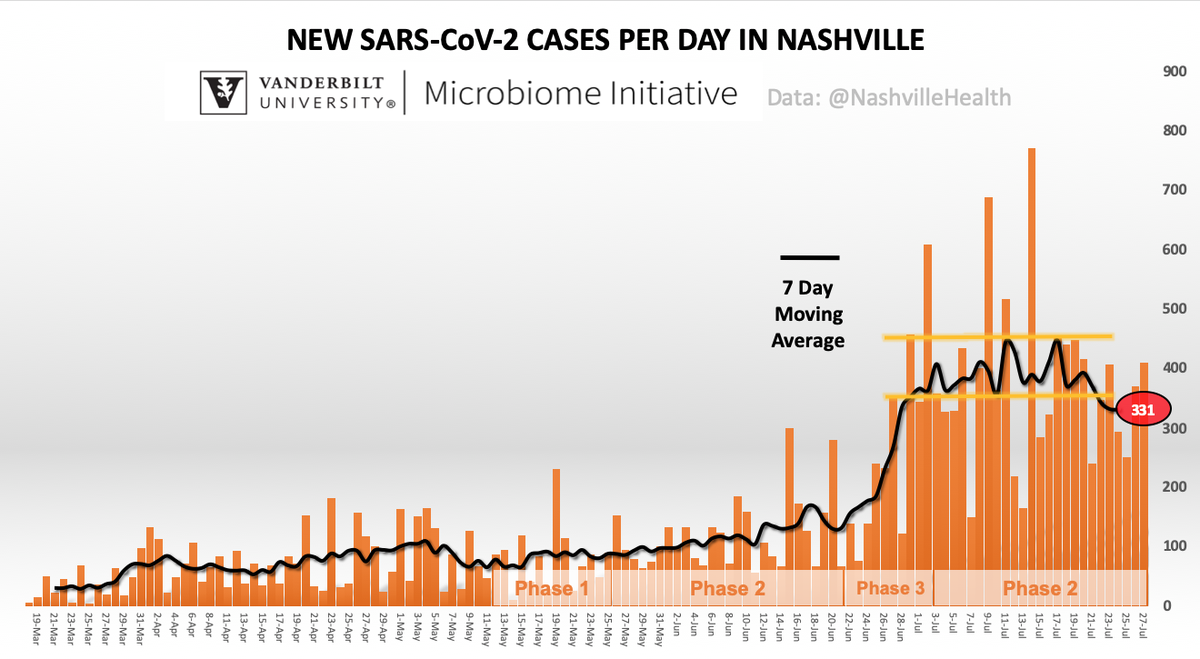
The 7-day moving average (red) dropped below a month-long threshold level (yellow lines).
Today, there is some evidence that increased adherence to mask wearing
 , etc. may be paying off.
The 7-day moving average (red) dropped below
 a month-long threshold level (yellow lines).
Note also in the above chart that there was no new daily spike (orange bar) in the past two weeks.
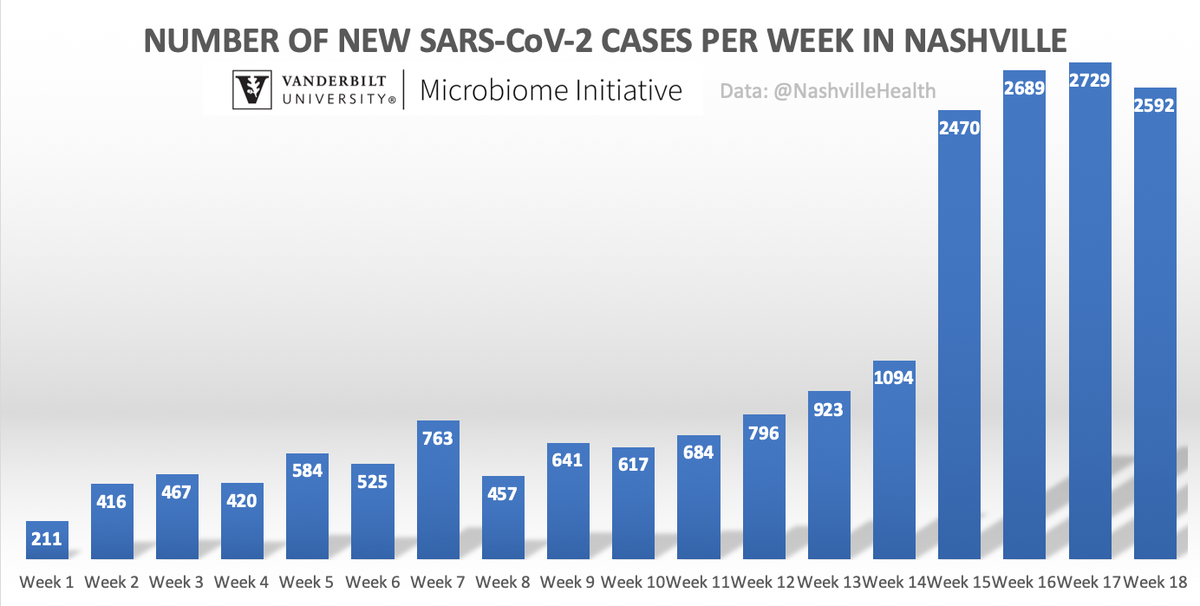
The weekly chart (sum per week) provides a different view on the case trend. We noted a couple of weeks ago that we would like to see this trend go down
It declined slightly.
The weekly chart (sum per week) provides a different view on the case trend. We noted a couple of weeks ago that we would like to see this trend go down

It declined slightly.
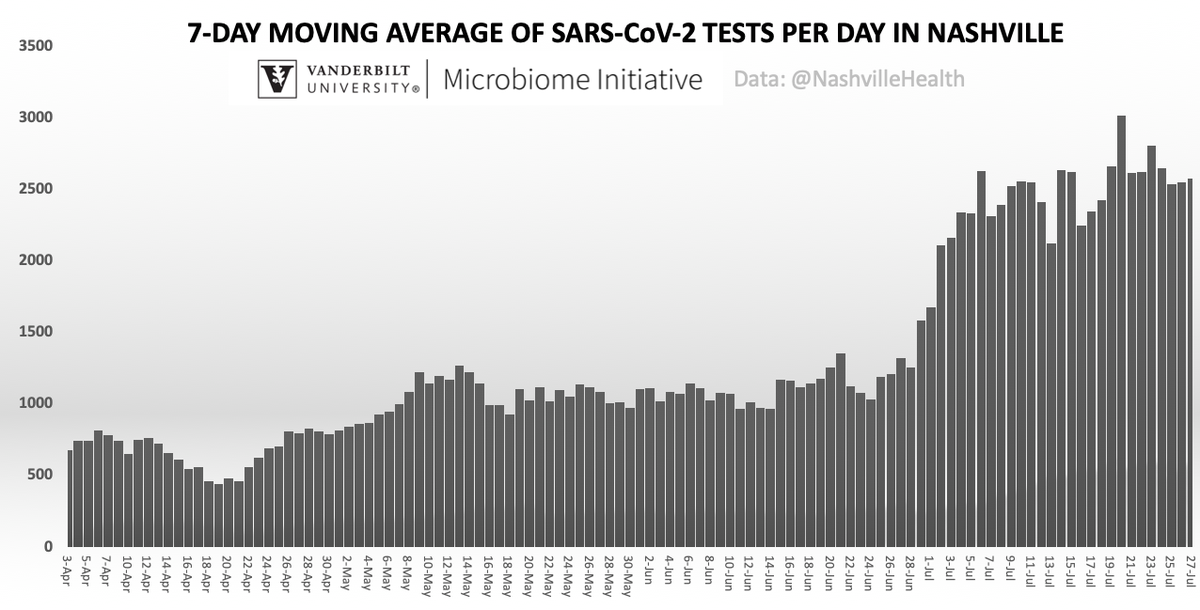
Testing capacity remains strong and robust for SARS-CoV-2 #coronavirus in #Nashville.
As always, THANK YOU to the health care frontline who take risks to take care of us.
As always, THANK YOU to the health care frontline who take risks to take care of us.
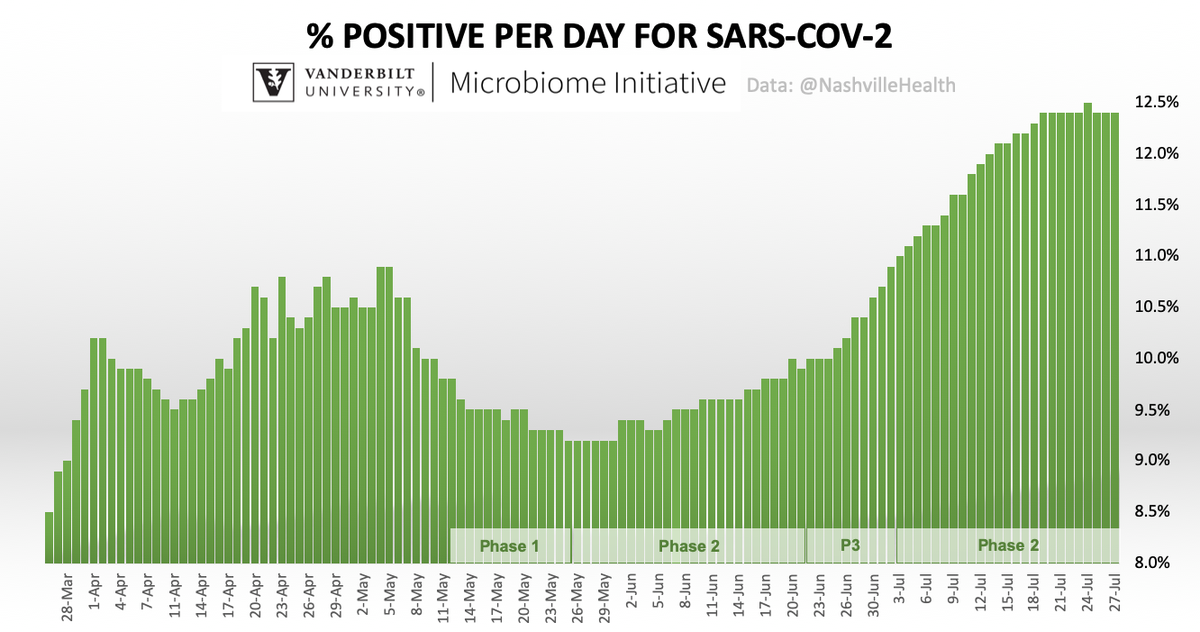
We recently noted the persistent flattening of our % graph.
It yielded one small indicator of the changing landscape.
With a one-day exception, that trend continues today.
We would like to see (i) testing remain strong and (ii) % go down for continued evidence.
 graph.
 It yielded one small indicator of the changing landscape.
With a one-day exception, that trend continues today.
We would like to see (i) testing remain strong and (ii) %
 go down for continued evidence.
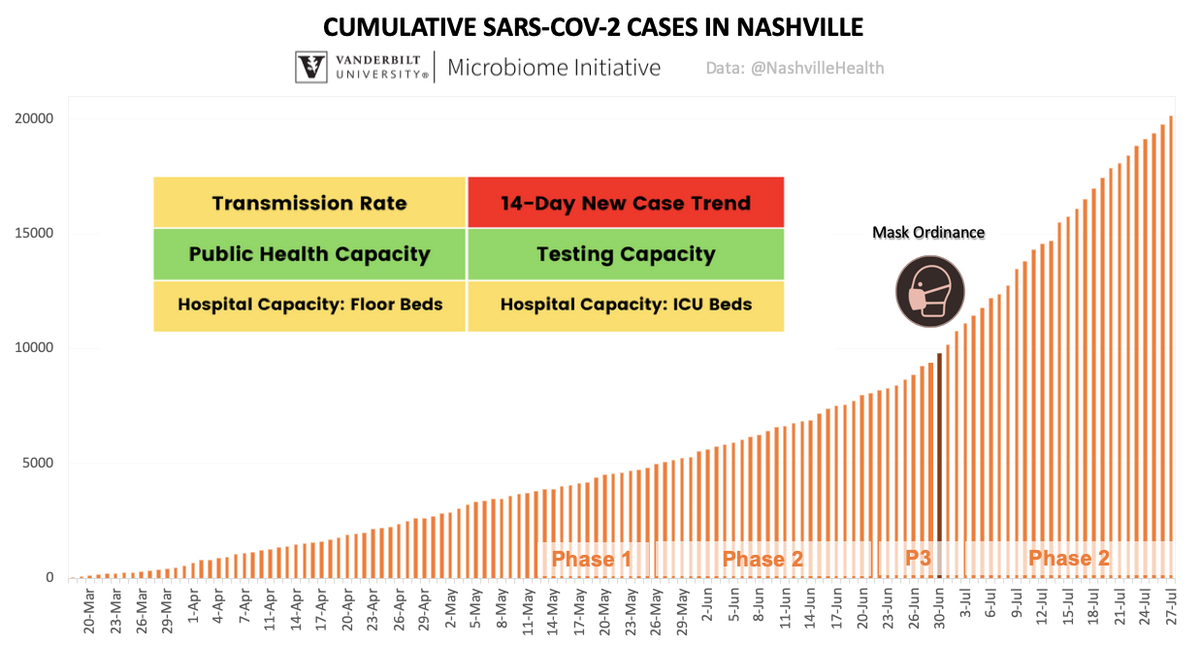
The cumulative case count shows the total history of SARS-CoV-2 #coronavirus cases in #Nashville, the mask ordinance date, and the city's alert system.
Hospital bed availability is hovering in a new range between 12-20% over the past 5 days.
Hospital beds: 17%
ICU beds: 12%
Hospital bed availability is hovering in a new range between 12-20% over the past 5 days.
Hospital beds: 17%
ICU beds: 12%
Hope everyone has a good week.
Be safe.
Then we and the pets can enjoy the city in full.
Be safe.
Then we and the pets can enjoy the city in full.

 Read on Twitter