Journey from 0 to 1 is full of difficult choices. It involves conducting a number of experiments to validate your hypothesis until you reach PMF or discover that there isn’t a market. Without a framework, one can easily get pulled in too many directions. Potential framework 

There are potentially multiple frameworks one can use for the 0 to 1 journey. For me, the journey is about three phases:
> Phase 1: Is there a problem?
> Phase 2: Is there a viable solution?
> Phase 3 Is there love?
> Phase 1: Is there a problem?
> Phase 2: Is there a viable solution?
> Phase 3 Is there love?
In Phase 1, you see a problem you’d like to solve but what if no one else feels passionate about the problem? Do enough people agree with you – do they see the problem you see? Goal isn’t to get to market size. Goal is to understand if you can find early adopters.
Potential ways to validate if a problem exists: Create a mock page and run FB ads to see if people click. Create a Whatsapp meme with an invitation to join your group to avail the product or service – see if people join. Create a mock page and invite people to join the waitlist
Tip: When validating the problem, go broad – avoid targeting a user segment. This will help you get a sense of who your early adopters will be. This is especially true if you are creating a category. Don’t assume anything. Discover the user, discover your market
Once you have identified your early adopters, Phase 2 begins. Phase 2 is the toughest and involves multiple iterations. Products that don’t hit PMF, fail at this stage – either the solutions you’ve thought of don’t stick or the solution that sticks is not scalable.
Tip: But it is impossible to find the right solution, if you have not first identified the metric you will measure. A good way to identify the right metric is to think about the core action for your solution that is indicative of ‘activation’.
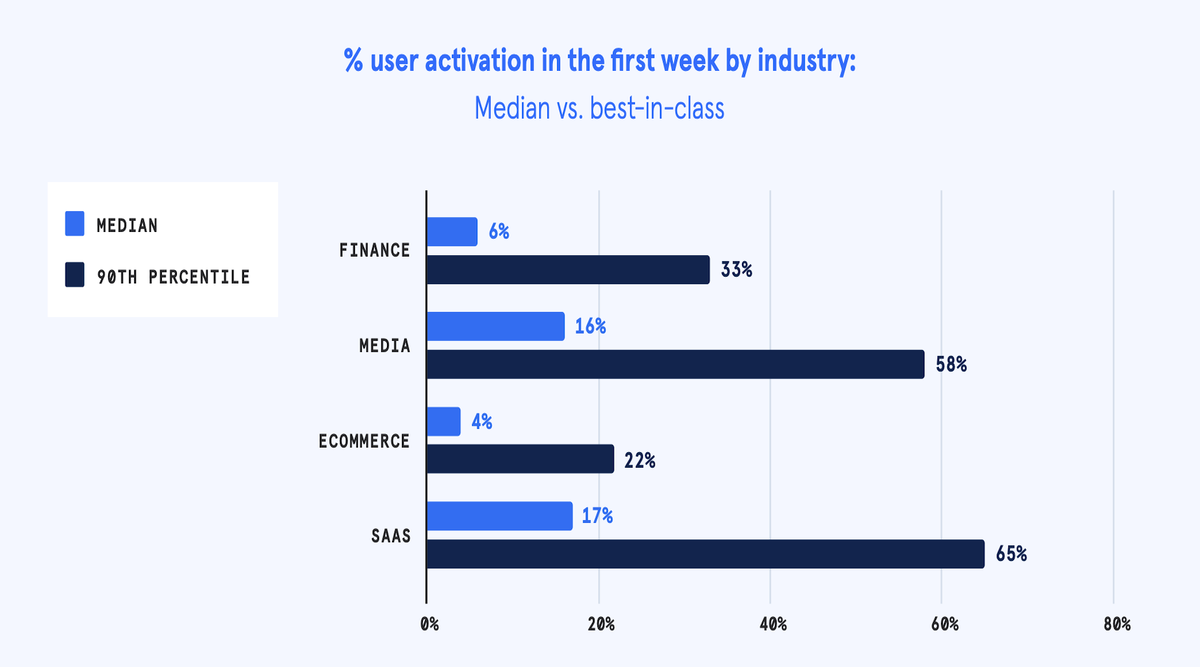
For eg, in a commerce solution, if a user searches for a product he is activated. Consuming one or more content pieces may be activation for a content platform. As activation number grows your PMF gets stronger. Some benchmarks for activation rates by industry.
Phase 3 – ‘Is there love?’ begins when you have a solution that successfully activates a significant portion of your base. Organic growth is a lagging indicator of user love. It is a great metric for investors to look at. As a founder, you need to chase the leading indicator
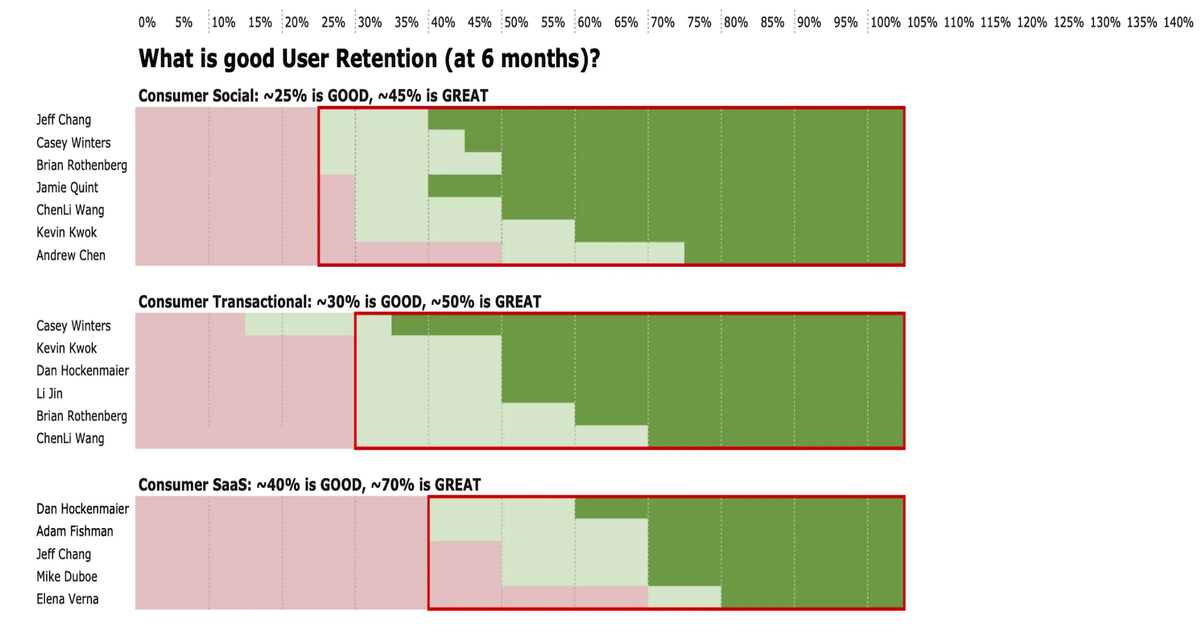
One leading indicator of user love is repeat usage. As users visit your platform often, the propensity for users to refer the product to other users goes up. So does retention rate.
@lennysan wrote a great post on retention benchmarks. Summary here:
https://twitter.com/lennysan/status/1277620704146423809
@lennysan wrote a great post on retention benchmarks. Summary here:
https://twitter.com/lennysan/status/1277620704146423809
For products that don’t lend themselves to high repeats (travel portals, for instance) measuring user love is difficult and the bar on new user experience is high! In such cases, NPS may be the only appropriate metric
Finally, this is just my framework. You may have others. Share here and show the light! Cheers..

 Read on Twitter


