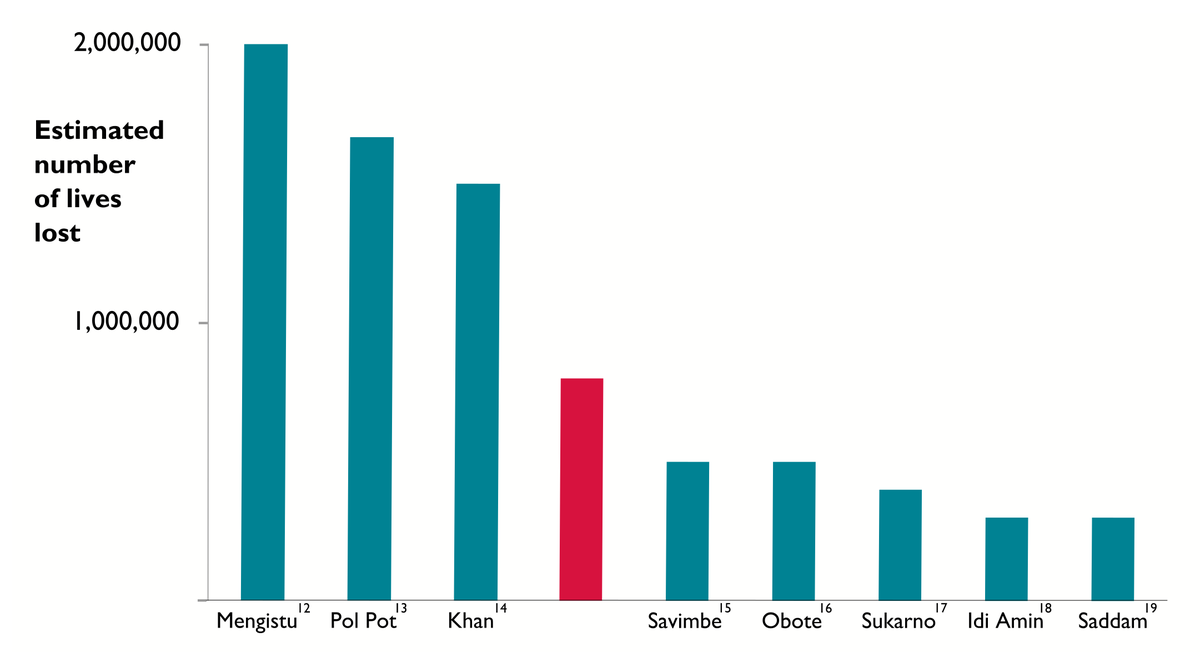
We've learned from bitter experience that showing the Pol Plot, as Graham likes to call it when waxing lyrical, requires a little bit of context.
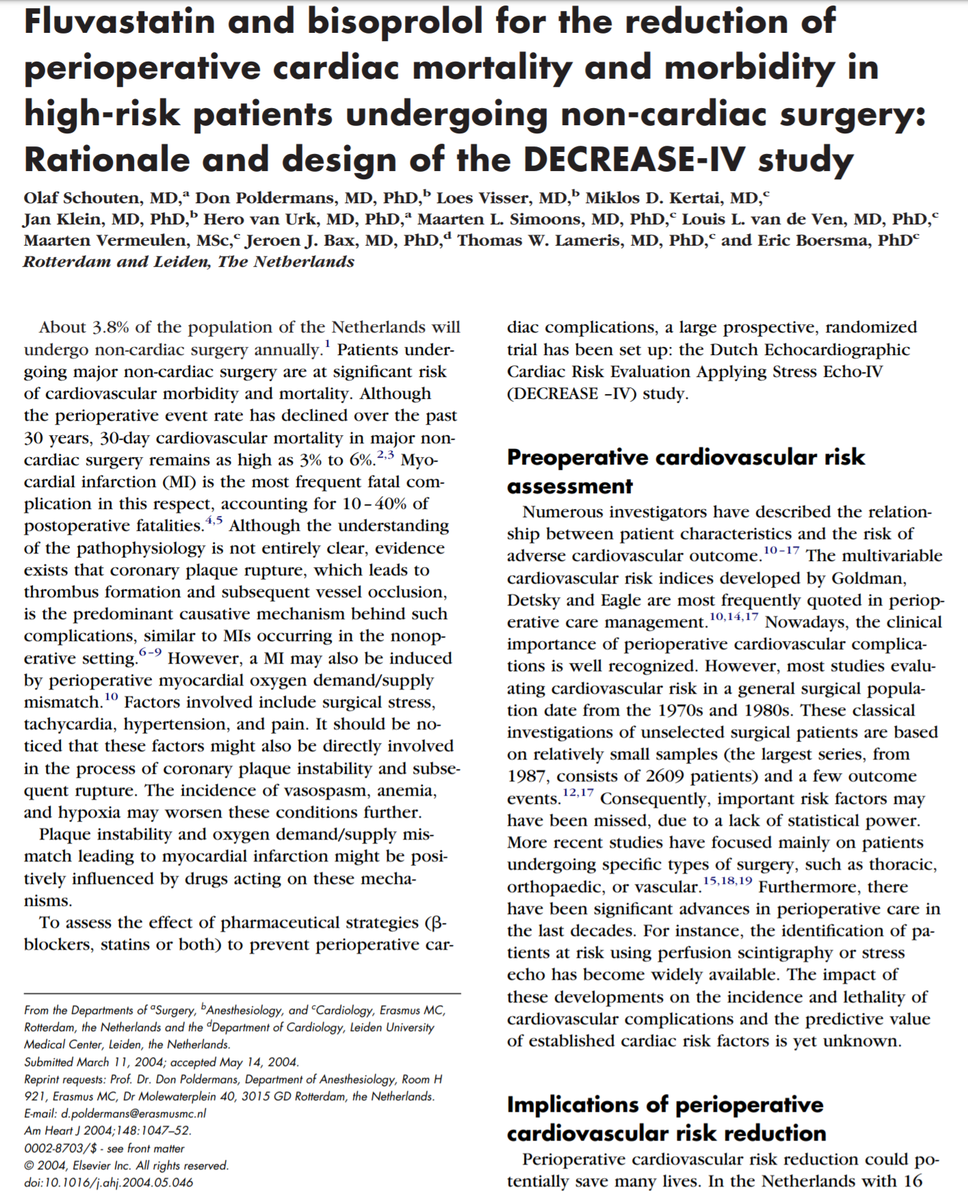
First, check this paper. https://pubmed.ncbi.nlm.nih.gov/15632892/
First, check this paper. https://pubmed.ncbi.nlm.nih.gov/15632892/
What is its status?
Status?
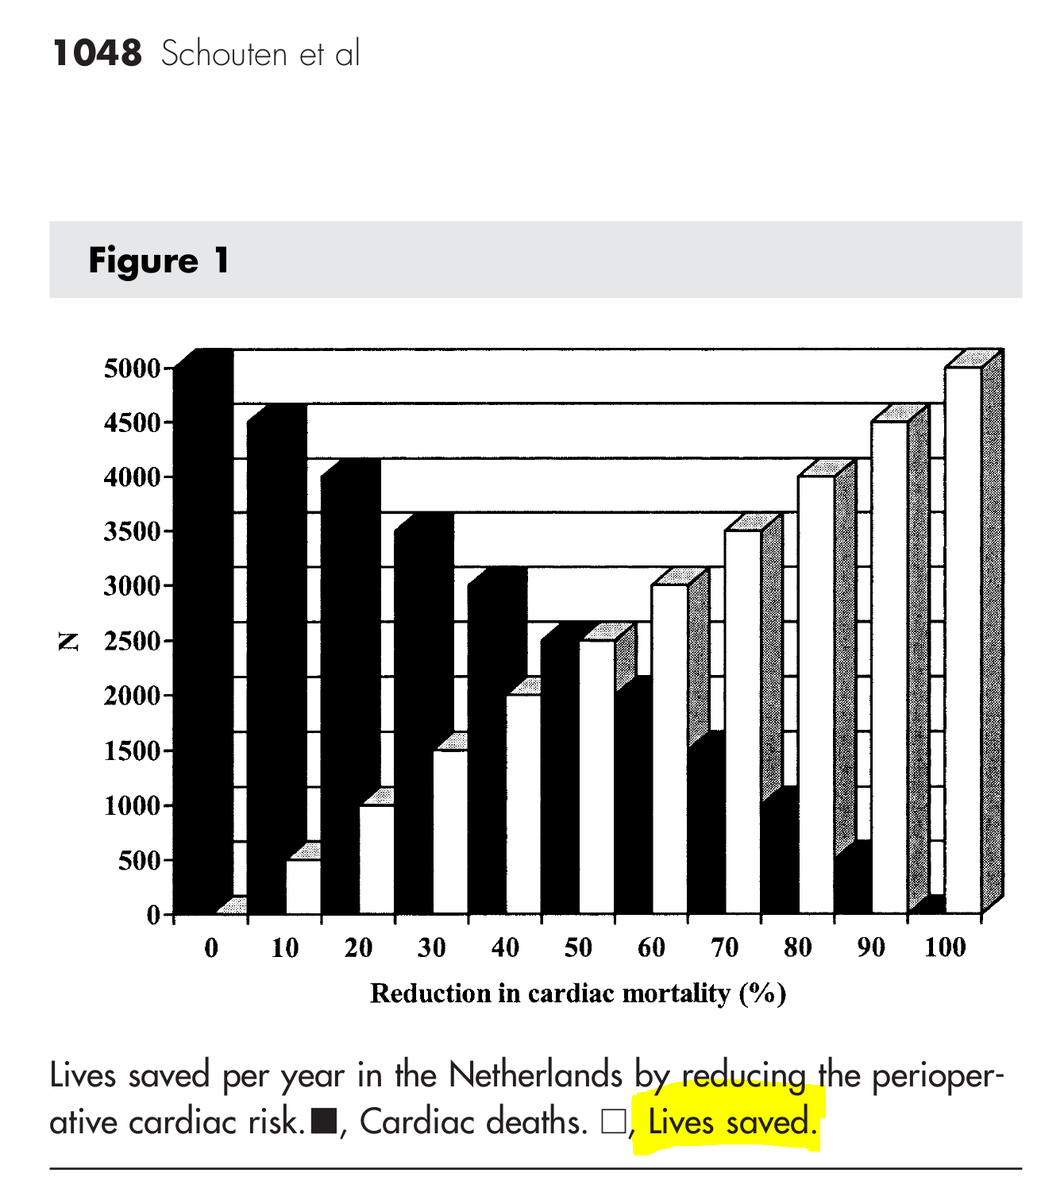
There is a single graph in this paper.
Eye-bleedingly vacuous, but it is there.
Just like Donald Trump became president because he was the least unpopular candidate out of n=2, this graph is the best graph in the paper due to there being no other graphs.
Eye-bleedingly vacuous, but it is there.
Just like Donald Trump became president because he was the least unpopular candidate out of n=2, this graph is the best graph in the paper due to there being no other graphs.
What do the white bars signifiy?
And by what high mechanism of science, did this peer reviewed paper, by the great and the good of European Cardiology (none of whom are in prison or anything) compose the values to plot?
Let's see...
Let's see...
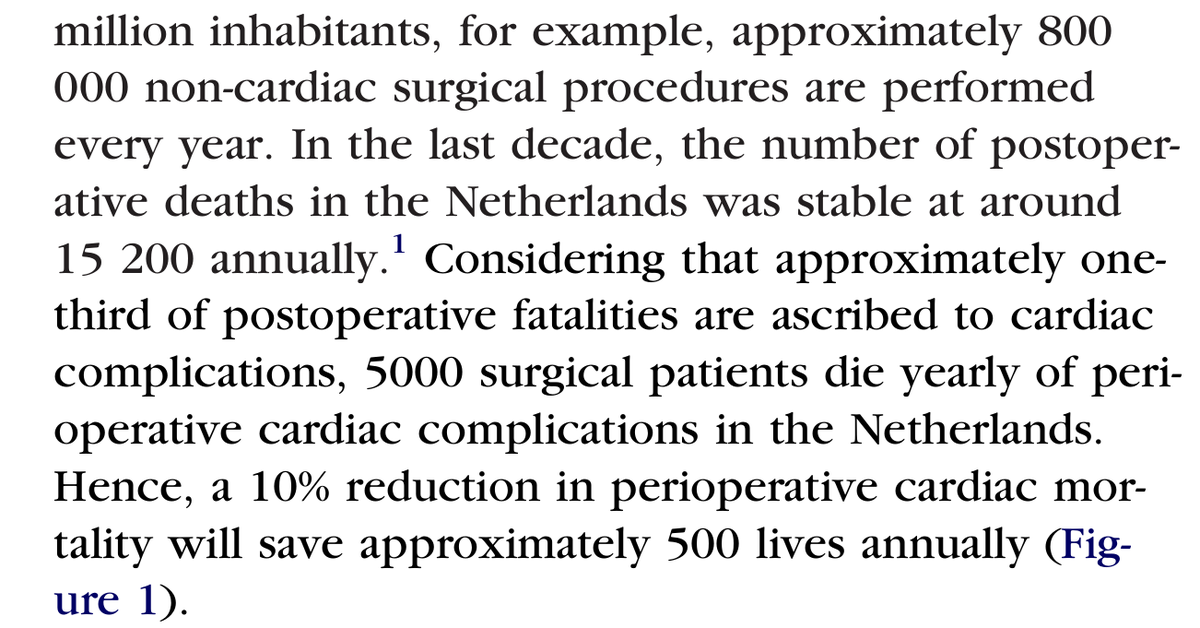
Hmmm.... looks like this article didn't specifically directly measure the effect size, but calculated it.
It multiplied numbers to calculate "lives saved".
One number was "Number of patients dying of perioperative cardiac complications"
It multiplied numbers to calculate "lives saved".
One number was "Number of patients dying of perioperative cardiac complications"
The other number was what?
OK so this methodology was developed by the ESC Experts that wrote the paper.
It was peer reviewed and published.
The paper is still cited now (and not in a sarcastic way, interestingly) for example by these papers:
It was peer reviewed and published.
The paper is still cited now (and not in a sarcastic way, interestingly) for example by these papers:
So does this method seem solid to you?
N deaths.
Relative risk change of 10%
Change in deaths is about 10% of N?
N deaths.
Relative risk change of 10%
Change in deaths is about 10% of N?
Right so the ESC experts proposed that method, and it seems reasonable to me.
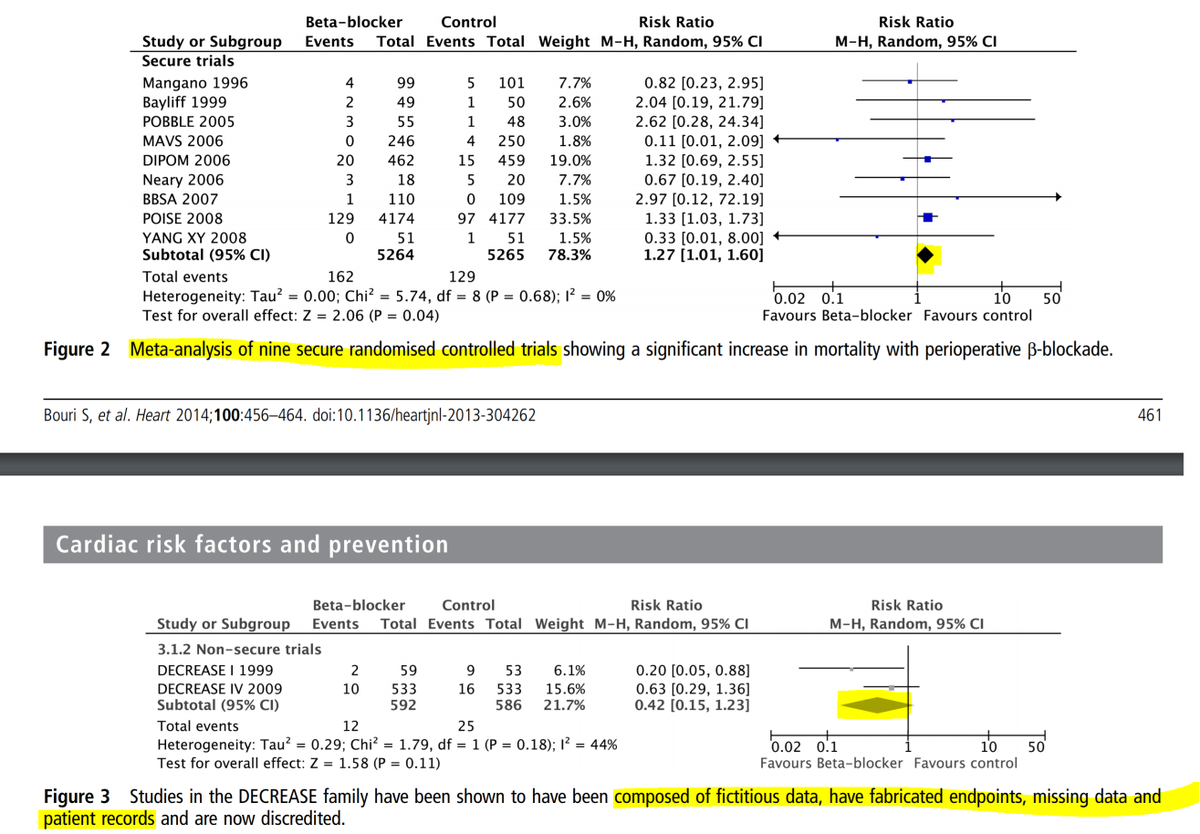
It so happens, now that the DECREASE trials are discovered to be made up, that we can now "update" our estimate for the relative risk reduction for death.
It so happens, now that the DECREASE trials are discovered to be made up, that we can now "update" our estimate for the relative risk reduction for death.
What is the relative risk reduction for death?
(For the non-made-up trials, obviously)
(For the non-made-up trials, obviously)
Okey kokey, so simply applying the identical formula, namely number of deaths * relative risk reduction ... (oh, it's a relative risk increase now, but the principle is the same)
we get the following:
we get the following:
Lives saved = N(deaths) * relative risk reduction
becomes
Lives killed = N(deaths) * relative risk increase
OK?
becomes
Lives killed = N(deaths) * relative risk increase
OK?
That "double-ziggurat" paper (as we fondly call it, after its pointless yet epilepsy-inducing figure) presents the info needed.
Netherlands: 800,000 operations per year
Europe: 40,000,000 operations per year
How much many more operations are done in Europe than the Netherlands?
Netherlands: 800,000 operations per year
Europe: 40,000,000 operations per year
How much many more operations are done in Europe than the Netherlands?
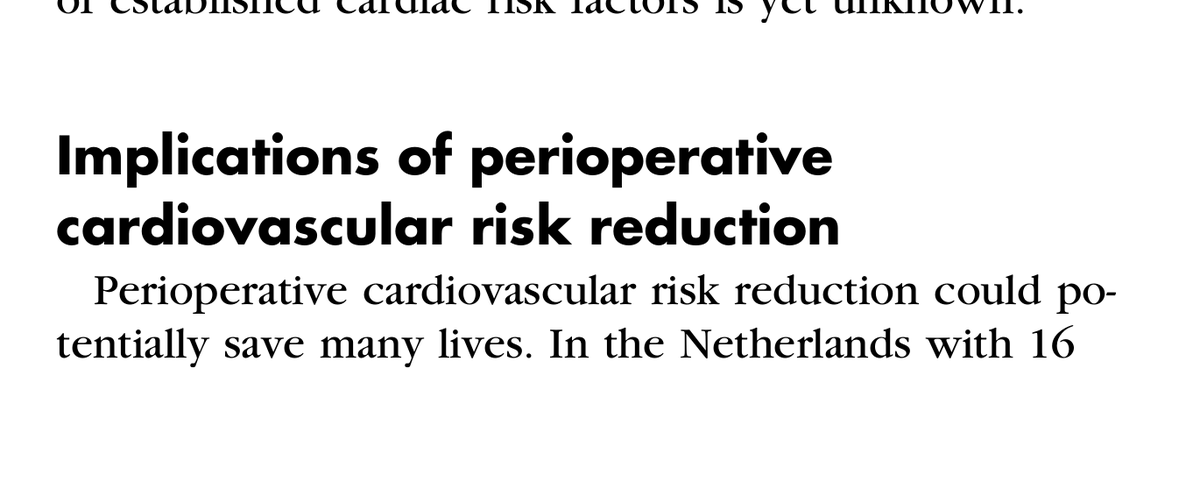
The paper also informs us that Netherlands has ~15,000 perioperative deaths per year.
So Europe might be expected to have roughly how many perioperative deaths, assuming pro-rata basis.
So Europe might be expected to have roughly how many perioperative deaths, assuming pro-rata basis.
Now by the ESC Expert formula,
Number of lives killed = Number of deaths * Relative risk increase
= 750,000 x 0.27
Which is what?
(Hint: 750 k is a bit less than 800 k, and 0.25 is a bit more than a quarter)
Number of lives killed = Number of deaths * Relative risk increase
= 750,000 x 0.27
Which is what?
(Hint: 750 k is a bit less than 800 k, and 0.25 is a bit more than a quarter)
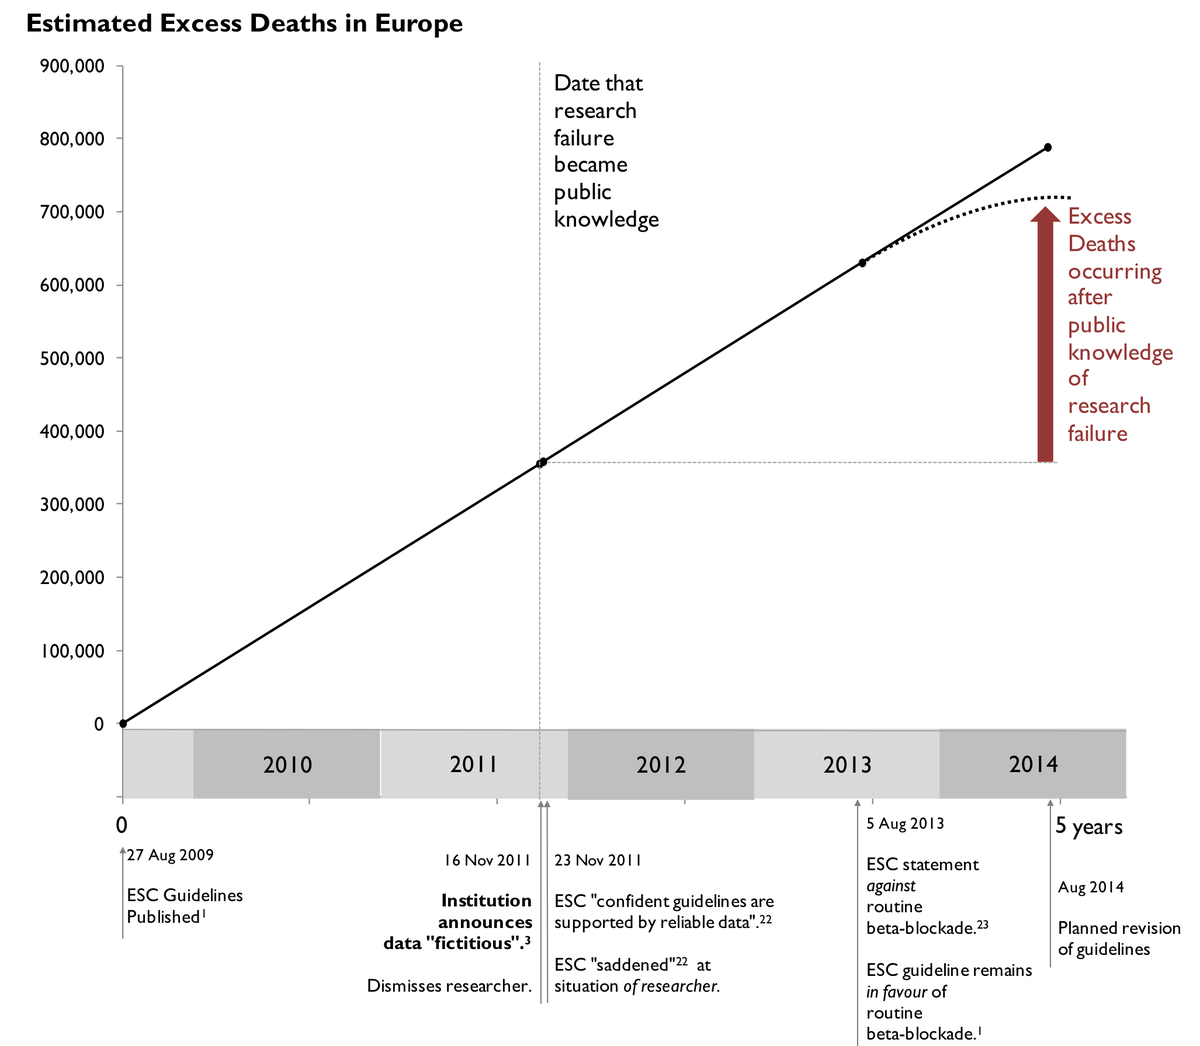
The interval between Perioperative Guidelines is 5 years.
So the benefit or harm from a guideline lasts for 5 years.
There is a lag, but that lag occurs both at onset and offset of any effect. So it doesn't affect the size of the net effect on lives saved or killed.
So the benefit or harm from a guideline lasts for 5 years.
There is a lag, but that lag occurs both at onset and offset of any effect. So it doesn't affect the size of the net effect on lives saved or killed.
UNLESS the normal flow of guidelines every four years is interrupted with a message:
"Emergency! We are retracting that guideline because it was written in good faith based on made-up data"
That could have a faster time course of action, reducing the cumulative effect.
"Emergency! We are retracting that guideline because it was written in good faith based on made-up data"
That could have a faster time course of action, reducing the cumulative effect.
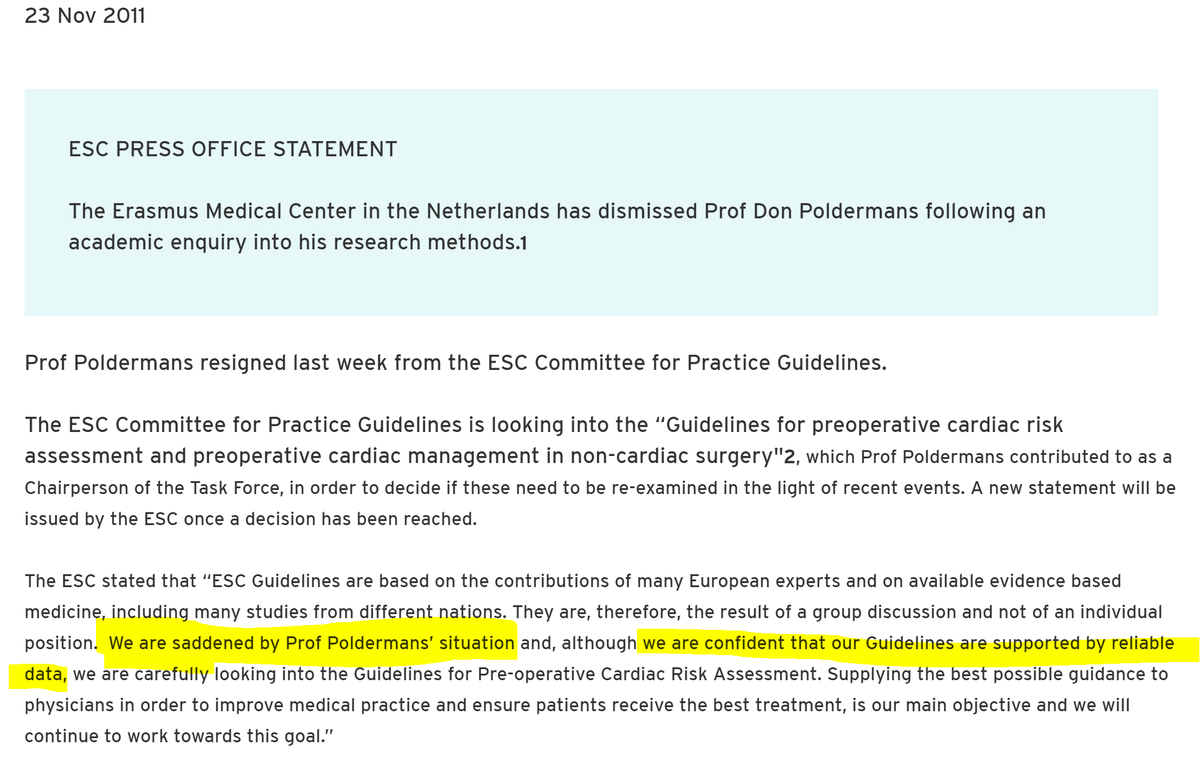
How did they feel about Poldermans being in the situation of being caught, after a career in medical fiction?
And did they cancel the guideline?
Or just delete the Polder-dependent recommendations?
Or just delete the Polder-dependent recommendations?
So, here is the Double-Ziggurat plot, updated with the actual data.
This caused a lot of people to become angry with us, because they forgot to read the text accompanying it, which is what (effectively) you have done now.
This caused a lot of people to become angry with us, because they forgot to read the text accompanying it, which is what (effectively) you have done now.
How does 800,000 sit in context, of other situations in the last half-century where leadership has prioritised
valuing their own vision of what reality should be, for political reasons,
above the interests of the people it should be protecting?
valuing their own vision of what reality should be, for political reasons,
above the interests of the people it should be protecting?
Have you read AND UNDERSTOOD the above question?

 Read on Twitter