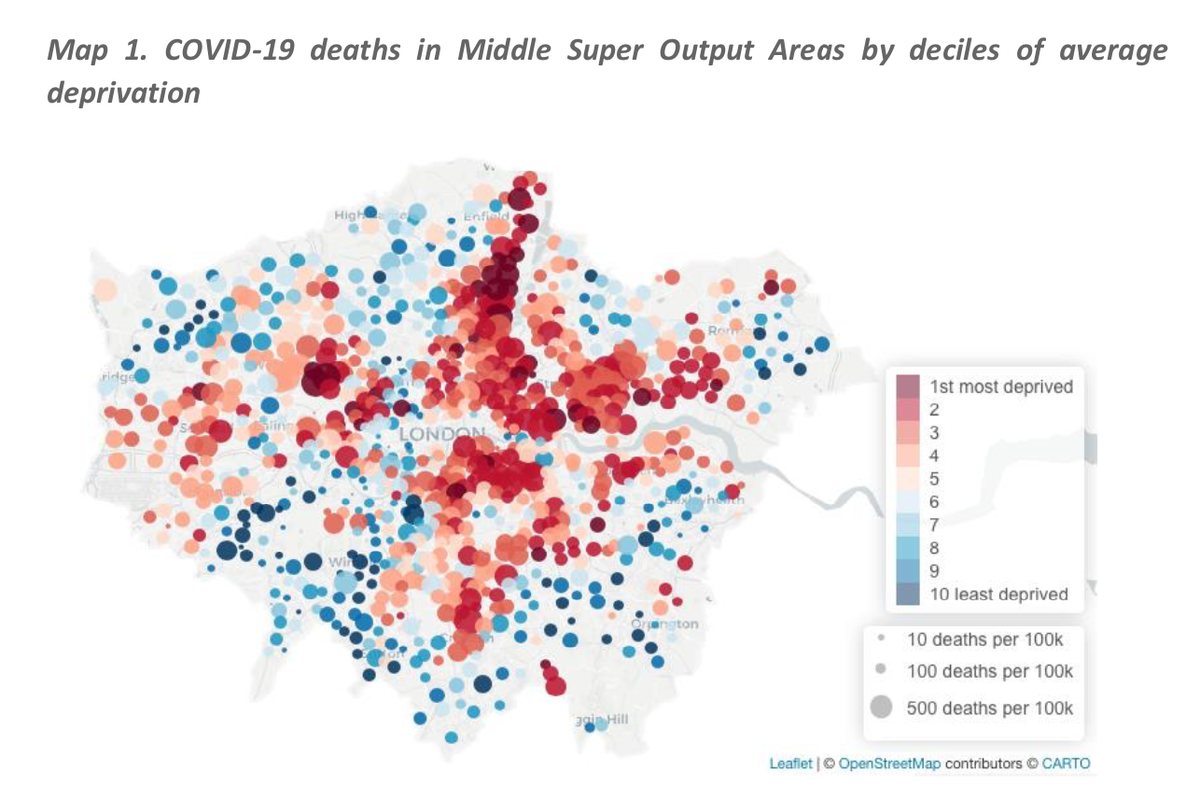
 New #COVID19 data analysis
For #LondonsPovertyProfile, our economics partner @wpi_economics has produced this working paper looking at the relationship between #COVID19 deaths in #London’s neighbourhoods & deprivation: https://bit.ly/COVID19lpp
Here are some key findings..1/8
On average, in March to May, the most deprived 20% of neighbourhoods saw 23 more #COVID19 deaths per 100,000 people than the least deprived 20%. Explore this map data here: https://bit.ly/3hslvpm
This is after controlling for a wide range of other neighbourhood measures 2/8
This is after controlling for a wide range of other neighbourhood measures 2/8
The most important neighbourhood factor overall was the count of residents aged 65 or older
Areas with higher numbers of over 65s would be expected to have 25 more #COVID19 deaths per 100,000 than those with lower numbers of over 65s 3/8
Areas with higher numbers of over 65s would be expected to have 25 more #COVID19 deaths per 100,000 than those with lower numbers of over 65s 3/8
The impact of higher numbers of care home residents in neighbourhoods is also large
There were 21 more #COVID19 deaths for areas with high numbers of care home residents compared to those with low numbers 4/8
There were 21 more #COVID19 deaths for areas with high numbers of care home residents compared to those with low numbers 4/8
#Ethnicity was important independently of other factors
Neighbourhoods with high numbers of Asian residents would be expected to experience 9 more #COVID19 deaths per 100,000, & those with high numbers of Black residents 13 more deaths 5/8
Neighbourhoods with high numbers of Asian residents would be expected to experience 9 more #COVID19 deaths per 100,000, & those with high numbers of Black residents 13 more deaths 5/8
Finally, neighbourhoods with higher numbers of residents working in sales & customer service occupations, as well as those with a higher number of children aged 0-14 had lower #COVID19 mortality, when controlling for other factors
6/8
These findings provide vital insights into the links between #COVID19 mortality & a range of neighbourhood characteristics in #London, particularly with regard to:
 deprivation
 age
age
 ethnicity
These relationships are complex, as is the analysis needed to unpick them 7/8
 deprivation
 age
age ethnicity
These relationships are complex, as is the analysis needed to unpick them 7/8
 Importantly, this shows the need for more data & more research
Measures we have at neighbourhood level explain just 35% of variation in#COVID19 mortality- the majority of influencing factors (65%) are not captured in our data. Read the full paper: https://bit.ly/COVID19lpp 8/8

 Read on Twitter


