I learned something today, so the day has not been wasted.
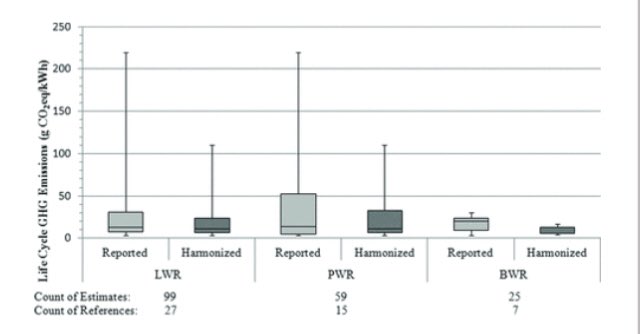
Regards to lifecycle greenhouse gas emissions of nuclear energy. People familiar to the topic have seen images like below many times (from https://onlinelibrary.wiley.com/doi/full/10.1111/j.1530-9290.2012.00472.x like the rest of the thread’s images too).
Regards to lifecycle greenhouse gas emissions of nuclear energy. People familiar to the topic have seen images like below many times (from https://onlinelibrary.wiley.com/doi/full/10.1111/j.1530-9290.2012.00472.x like the rest of the thread’s images too).
Collected results from various life cycle analysis. Median and quartiles well clumped in low GHG intensity values, then some major outliers.
Typically I’m just, well outliers are outliers, but there’s certain group adamantly insisting that only those count.
Typically I’m just, well outliers are outliers, but there’s certain group adamantly insisting that only those count.
So it would be nice to explain where those outliers come from. Some may claim that the big outliers are because they’re the only ones taking everything into account, but it would mean tens of papers just utterly fail.
Fortunately these researchers from NREL did the hard work.
Fortunately these researchers from NREL did the hard work.
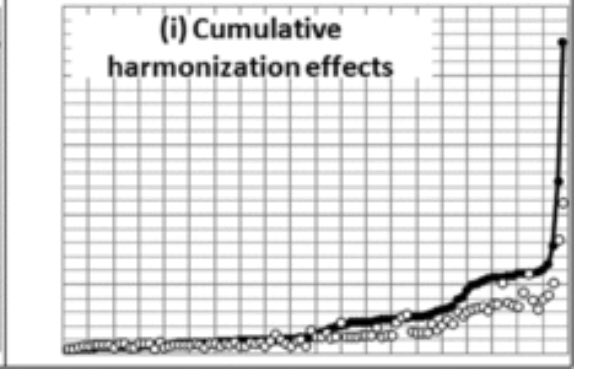
They harmonized methodologies of lots of studies (original GHG intensity in black, harmonized in white). Some very low results increased as some parts of life cycle were accounted for, the big outliers were lowered but quite big discrepancy still was left.
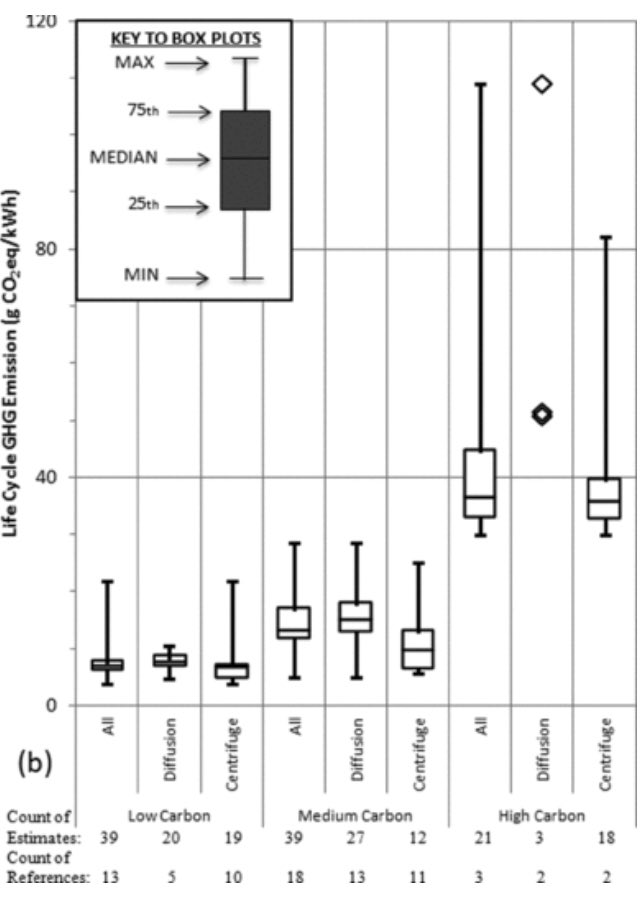
Next the scenarios were grouped to different groups. See the high emissions group where all the high intensity results lie. Other groups have maximum life cycle emissions intensity below 30 gCO2/kWh, which I hope everyone can agree is low.
The big difference between these groups?
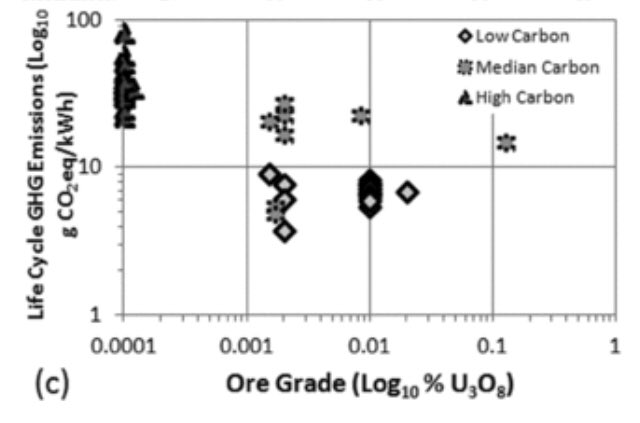
Assumed ore grade. High emissions group apparently universally assumed ore grade of 0.01% uranium, with other analyses from 0.1% upwards. This is quite a figure.
Assumed ore grade. High emissions group apparently universally assumed ore grade of 0.01% uranium, with other analyses from 0.1% upwards. This is quite a figure.
I had been under impression that the enrichment technology choice was the culprit, but apparently not. Assumption of ore grade appears to be a big divider: assume currently mined grades, and the emission intensity of nuclear electricity is low.
So finally I tried to find the ore grades for current mines but did not find a good overview. Some high outliers have over 10%, it seems 0,05% grades are mined. But, I’d say, assuming 0,01% grade now is not realistic.
So that’s why many pieces on how GHG-intensive nuclear energy is make claims on using low grades in the future. How realistic is that?
Well NEA red book on uranium resources states currently usable resources last 100+ years. https://www.oecd-nea.org/ndd/pubs/2018/7413-uranium-2018.pdf
Well NEA red book on uranium resources states currently usable resources last 100+ years. https://www.oecd-nea.org/ndd/pubs/2018/7413-uranium-2018.pdf
So in conclusion pretty big reason for outliers appears to be the assumption of very low ore grades mined; and it might not be that good an assumption as current uranium resources last quite a while.
Well today I learned something that had been bothering me. Good day.
Well today I learned something that had been bothering me. Good day.
PS:
And the uranium ore grade does not explain all the difference in the analysis groups (especially as the harmonization brings outliers down a lot!). But it’s a good marker, and there are probably some other judgement calls into the same direction in the high end analyses.
And the uranium ore grade does not explain all the difference in the analysis groups (especially as the harmonization brings outliers down a lot!). But it’s a good marker, and there are probably some other judgement calls into the same direction in the high end analyses.

 Read on Twitter


