"Measuring the Economic Impact of Covid-19
with business website data"
I enjoyed presenting joint work w/ @AlexJBishop at today's @ESCoEorg seminar. Thank you for inviting us @rebeccasriley!
This thread summarises that we did & what we found.
Slides:
https://nesta-test.s3.eu-west-2.amazonaws.com/escoe_presentation/escoe_covid-19_final.pdf
with business website data"
I enjoyed presenting joint work w/ @AlexJBishop at today's @ESCoEorg seminar. Thank you for inviting us @rebeccasriley!
This thread summarises that we did & what we found.
Slides:
https://nesta-test.s3.eu-west-2.amazonaws.com/escoe_presentation/escoe_covid-19_final.pdf
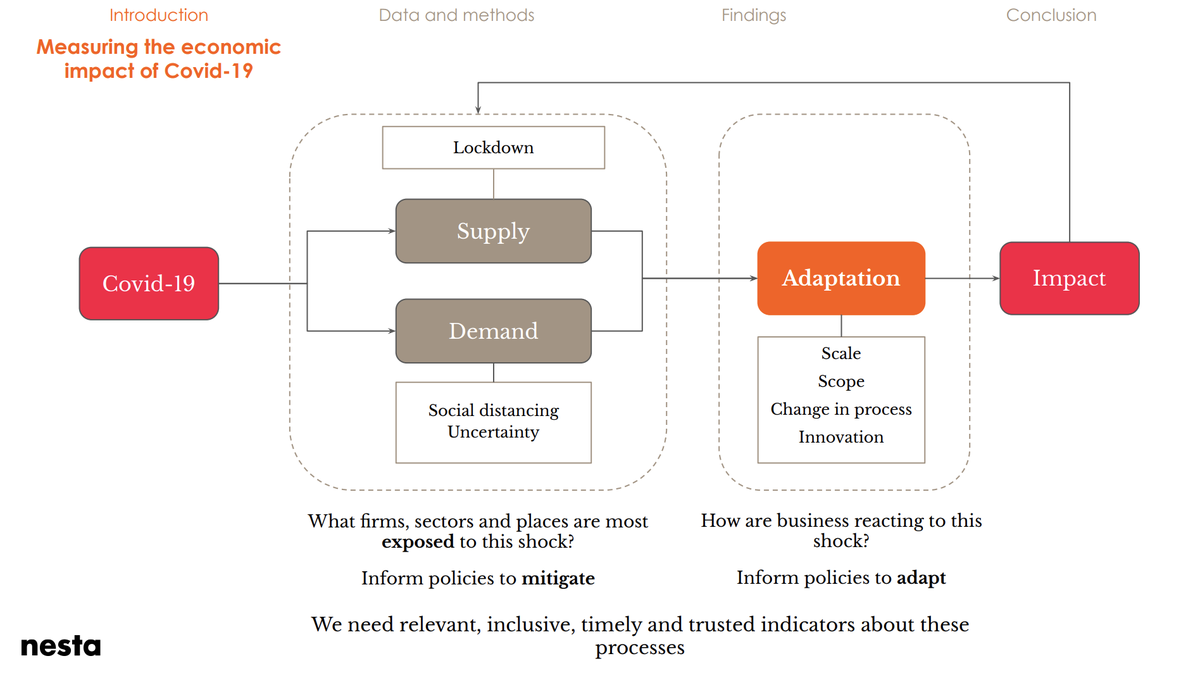
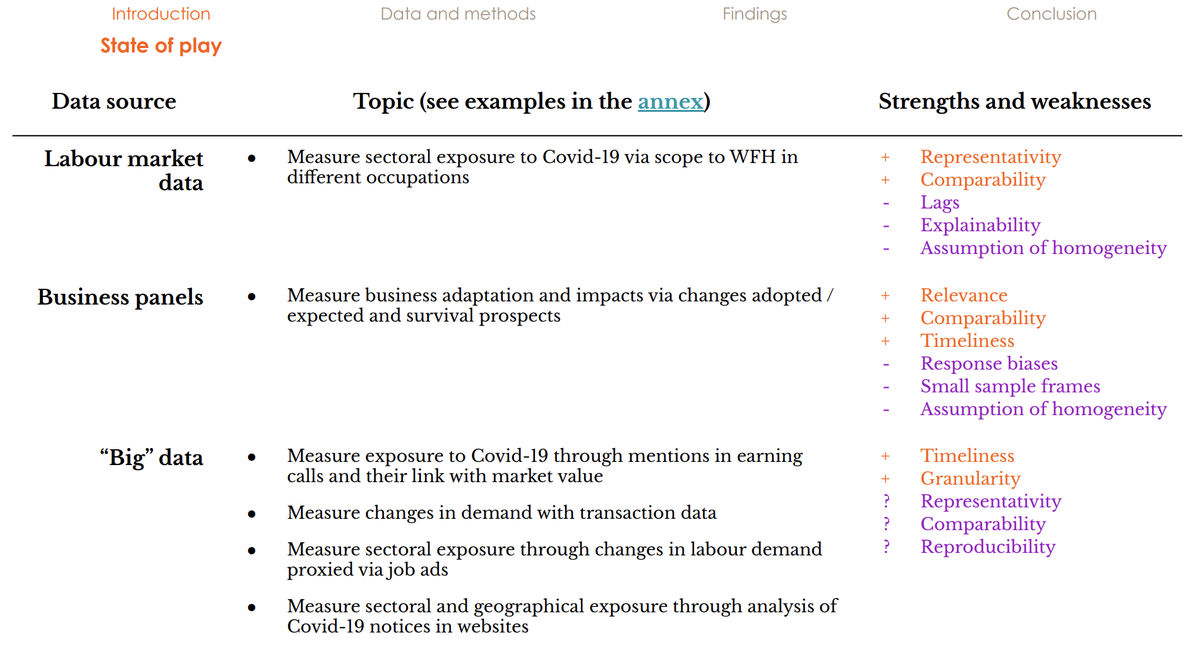
1. Starting point: we want relevant, inclusive and trusted indicators to measure economic exposure & adaptation to Covid-19 in firms, sectors and places (#1)
There has been much effort to build these indicators using labour market, official and 'big' data (#2)
There has been much effort to build these indicators using labour market, official and 'big' data (#2)
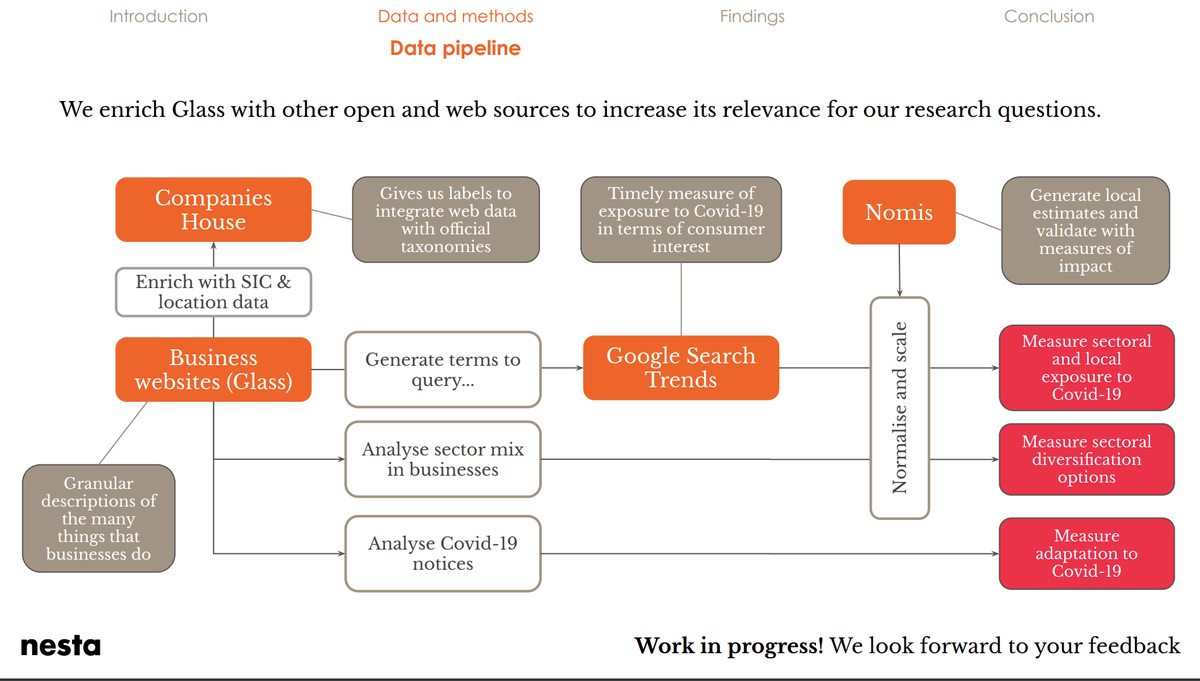
2. What we did: We have combined business website ( @_GlassAI) data with Companies House, Google Search trends and @ONS data to measure sector / geography exposure to Covid-19, opportunities to diversify away from it, and firm level response (through Covid-19 website notices).
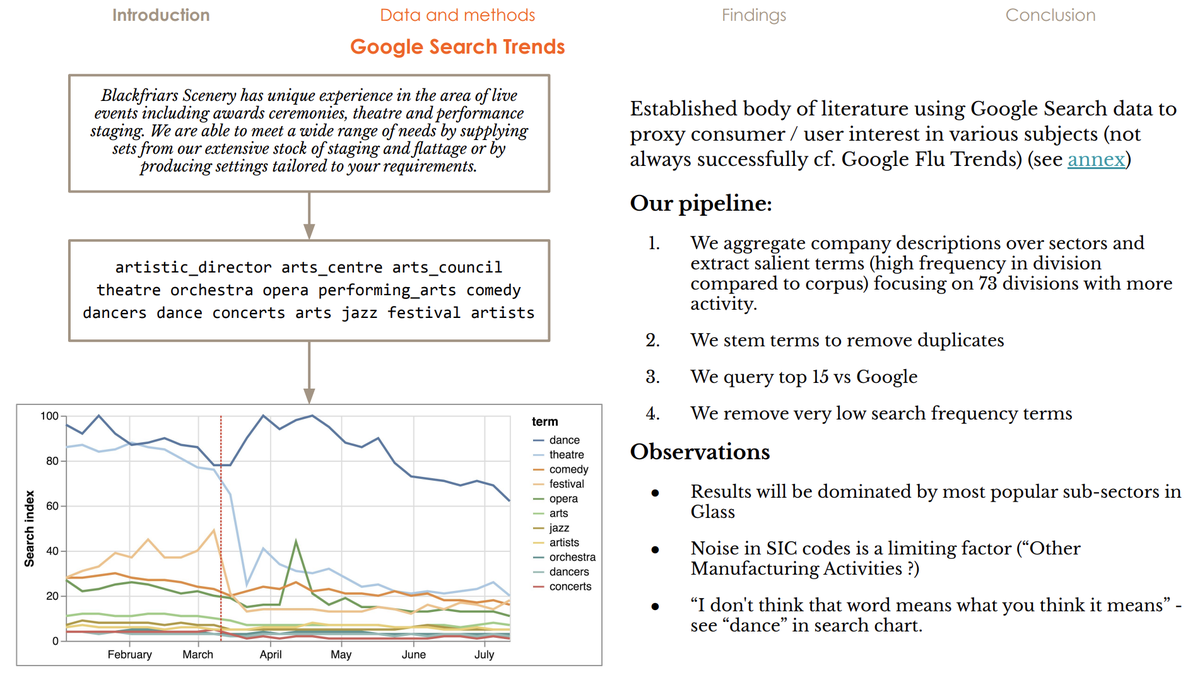
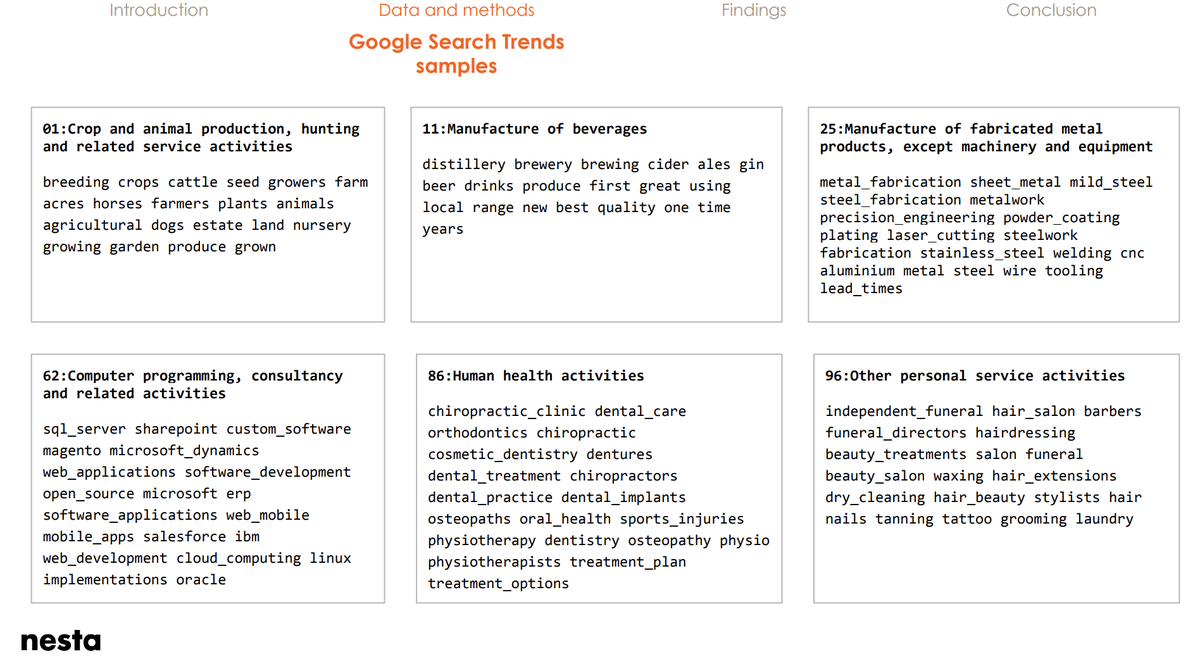
2a. More specifically we aggregate business descriptions over sectors and extract salient terms that we then run against Google Search (#1). The results look good for an automated procedure (see examples #2).
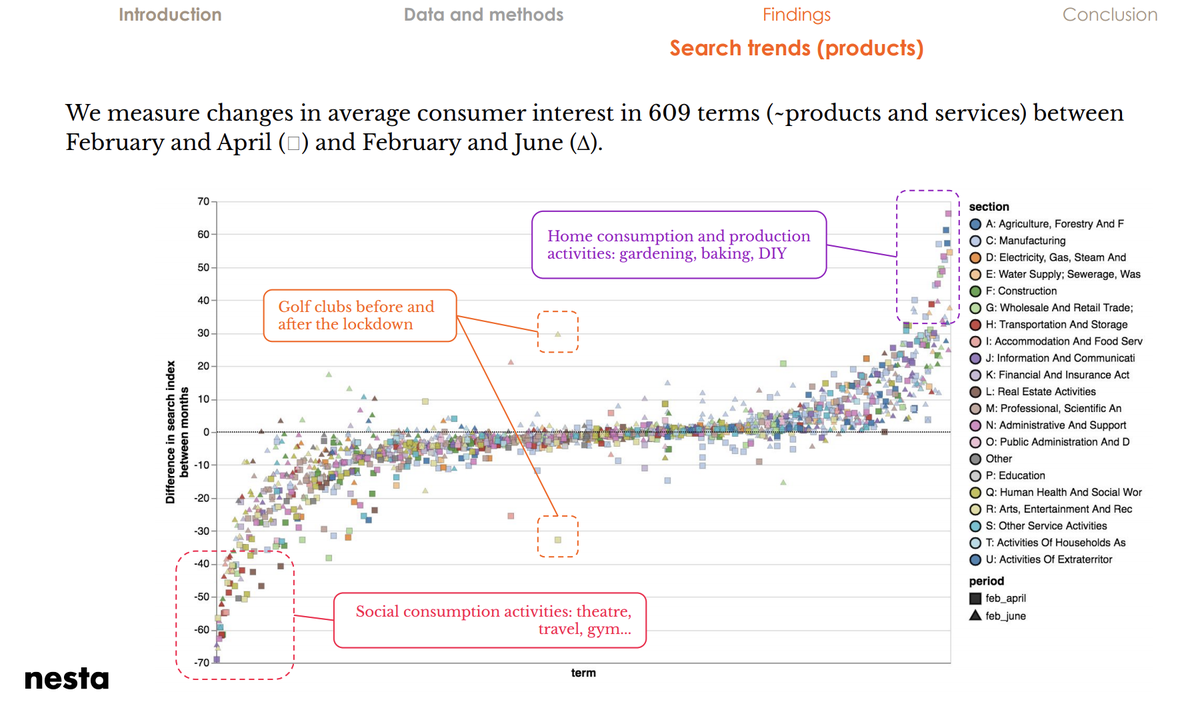
3. What we found (products): Changes in search interest in categories seems to be picking up the impact of Covid-19 on consumer interest / sentiment. More bread, less circus, and less golf clubs until the lock down was eased.
Interactive chart here : https://nesta-test.s3.eu-west-2.amazonaws.com/escoe_presentation/product_interest.html
Interactive chart here
 : https://nesta-test.s3.eu-west-2.amazonaws.com/escoe_presentation/product_interest.html
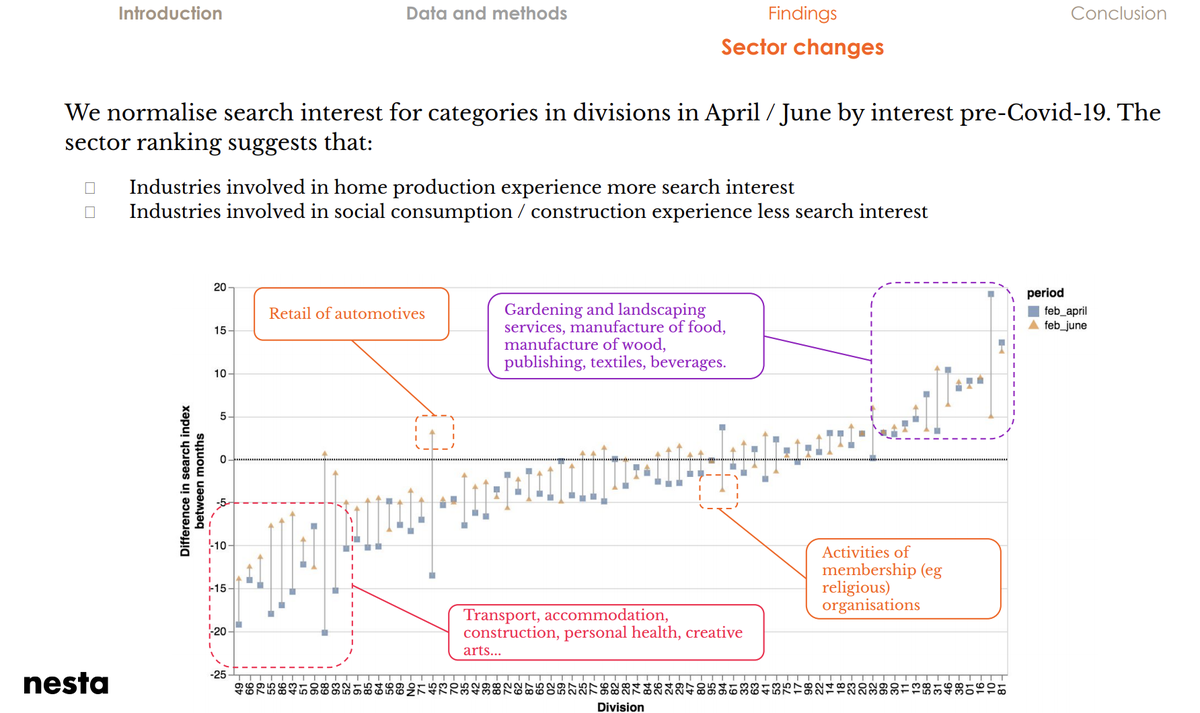
3b. What we found (sectors). The search data shows a decline in interest in the usual (social consumption) industries but things are slowly going back to normal. Things don't go back to normal in Arts or Transport though.
[ ] https://nesta-test.s3.eu-west-2.amazonaws.com/escoe_presentation/division_trends.html
[
 ] https://nesta-test.s3.eu-west-2.amazonaws.com/escoe_presentation/division_trends.html
3c. We aggregate changes over months and use post / pre Covid-19 as a proxy for exposure. We then look at the share of employment in negatively / positively exposed sectors in different places (TTWAs)
 : https://nesta-test.s3.eu-west-2.amazonaws.com/escoe_presentation/sector_interest.html
 : https://nesta-test.s3.eu-west-2.amazonaws.com/escoe_presentation/sector_interest.html
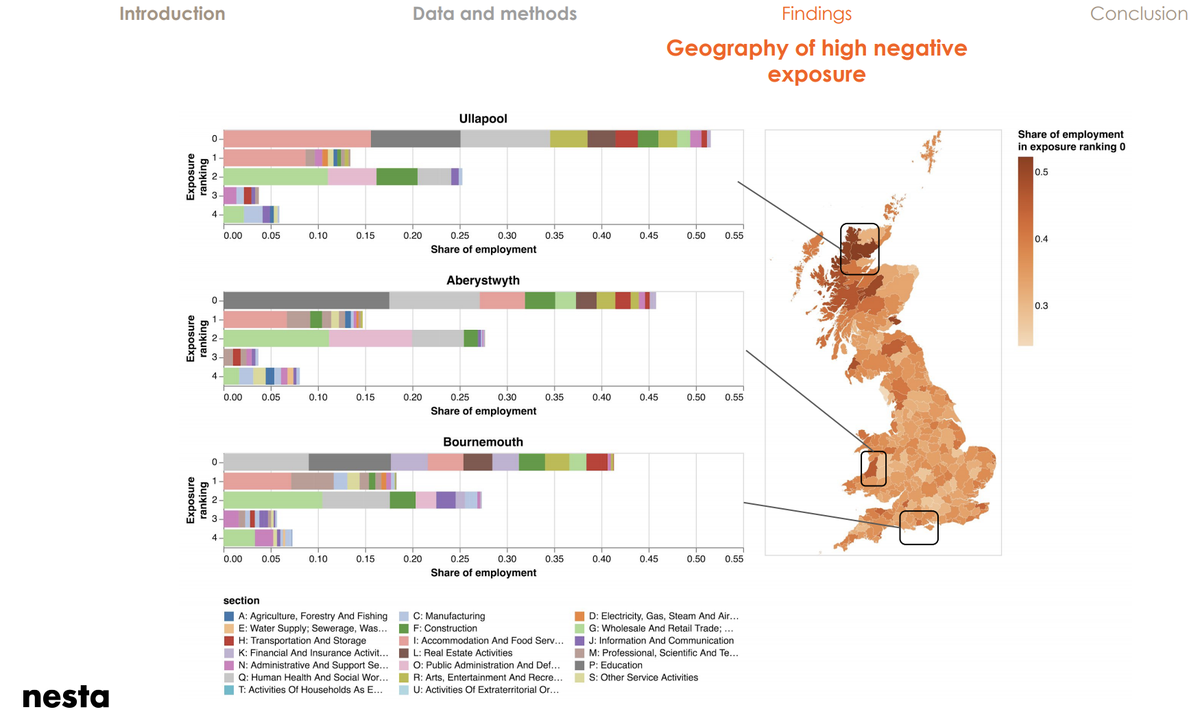
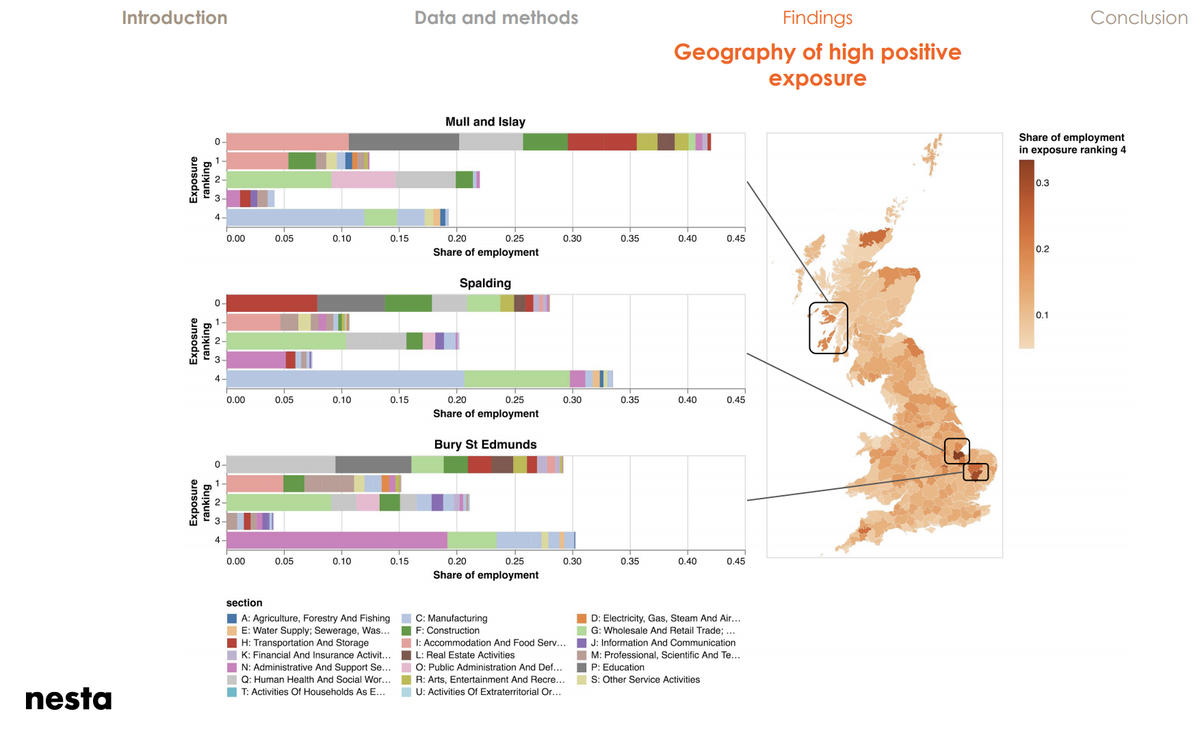
3d. We find that places are exposed to Covid in their own special ways depending on their sectoral composition. Cf three negatively exposed places (#1) and three positively exposed places (#2).
 1. https://nesta-test.s3.eu-west-2.amazonaws.com/escoe_presentation/high_negative_exposure_profiles.html
 2: https://nesta-test.s3.eu-west-2.amazonaws.com/escoe_presentation/high_positive_exposure_profiles.html
 1. https://nesta-test.s3.eu-west-2.amazonaws.com/escoe_presentation/high_negative_exposure_profiles.html
 2: https://nesta-test.s3.eu-west-2.amazonaws.com/escoe_presentation/high_positive_exposure_profiles.html
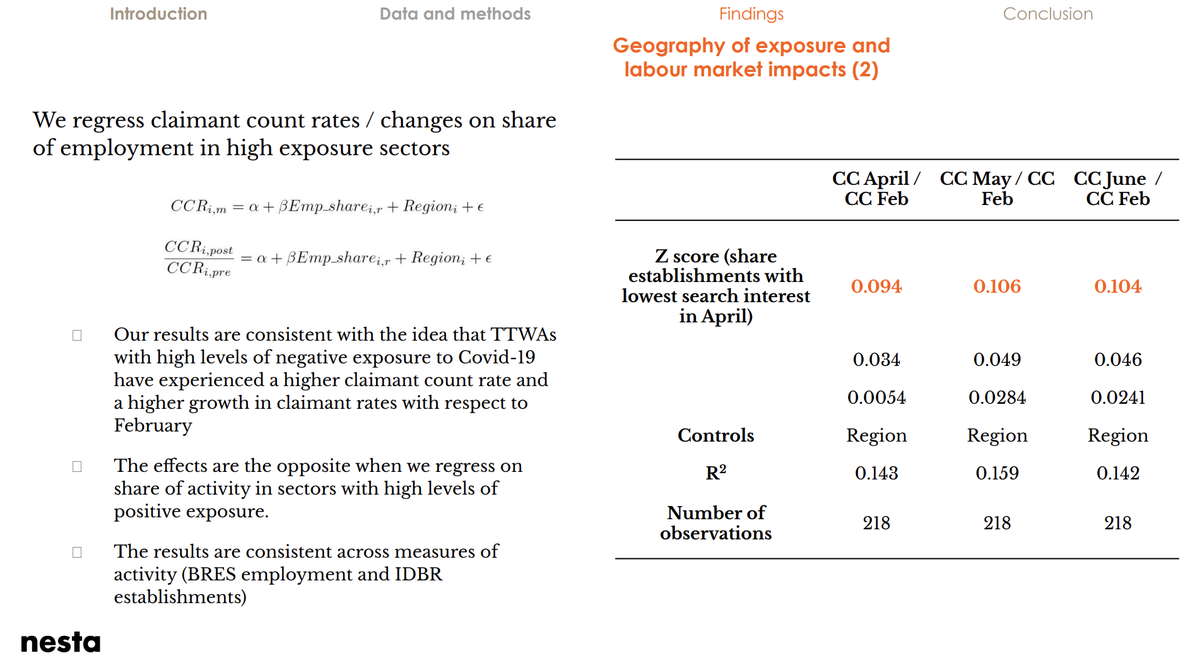
3e. Is exposure to Covid-19 linked to labour market outcomes? Our regression of local benefit claimant growth on share of employment in negatively exposed sectors suggest as much (although we note concerns about claimant counts as a measure of Covid-19 induced employment)
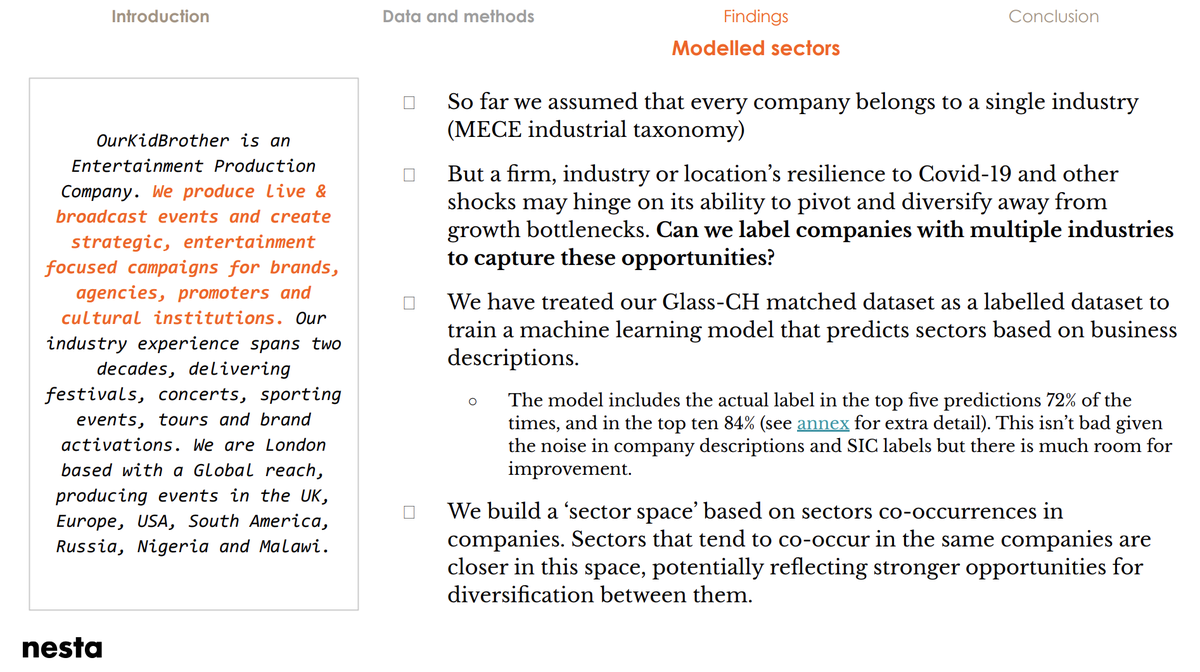
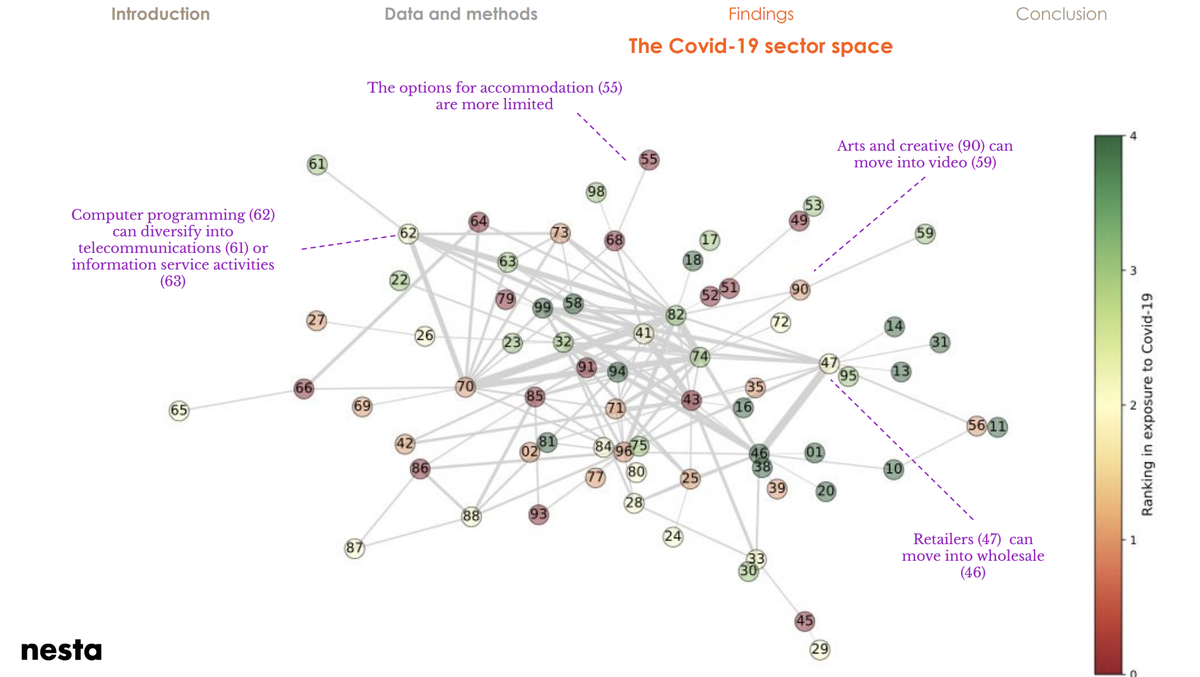
3f. But what about diversification options? (#1) We use machine learning to label all companies with sector probabilities and create a sector space (#2) helping us to understand diversification options for different companies & locations (obs inspired by @cesifoti).
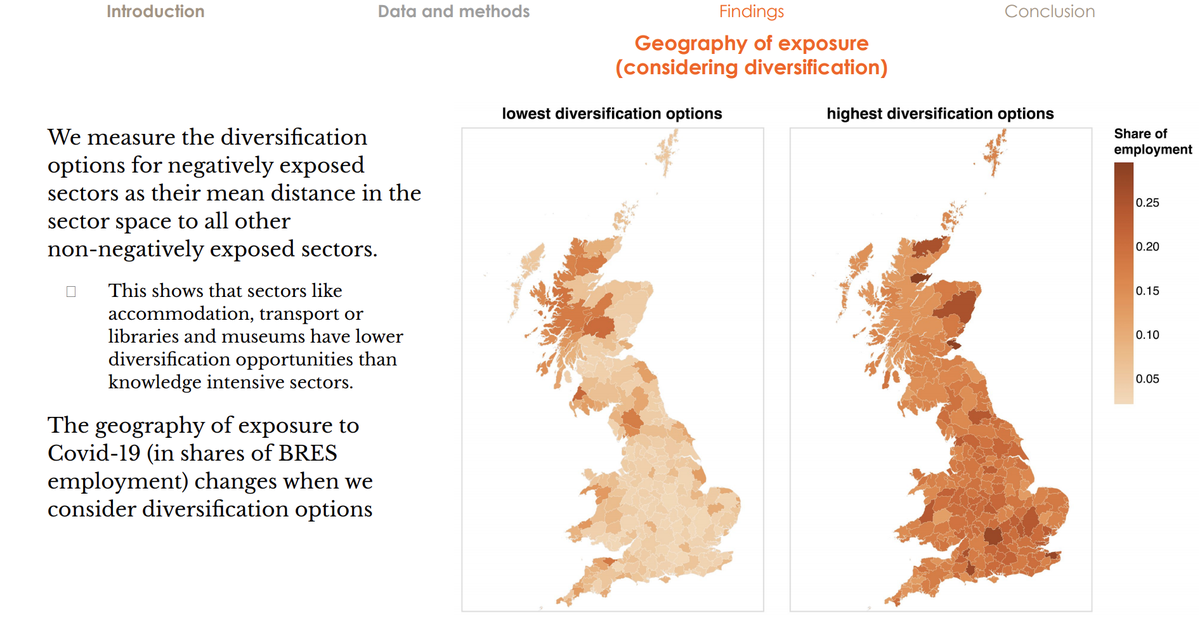
3g. We see some marked differences in the geography of places negatively exposed to Covid-19 that have few opportunities for diversification (coastal towns and rural areas) and those that may be able to diversify (cities & knowledge hubs).
 : https://nesta-test.s3.eu-west-2.amazonaws.com/escoe_presentation/diversification_choropleth.html
 : https://nesta-test.s3.eu-west-2.amazonaws.com/escoe_presentation/diversification_choropleth.html
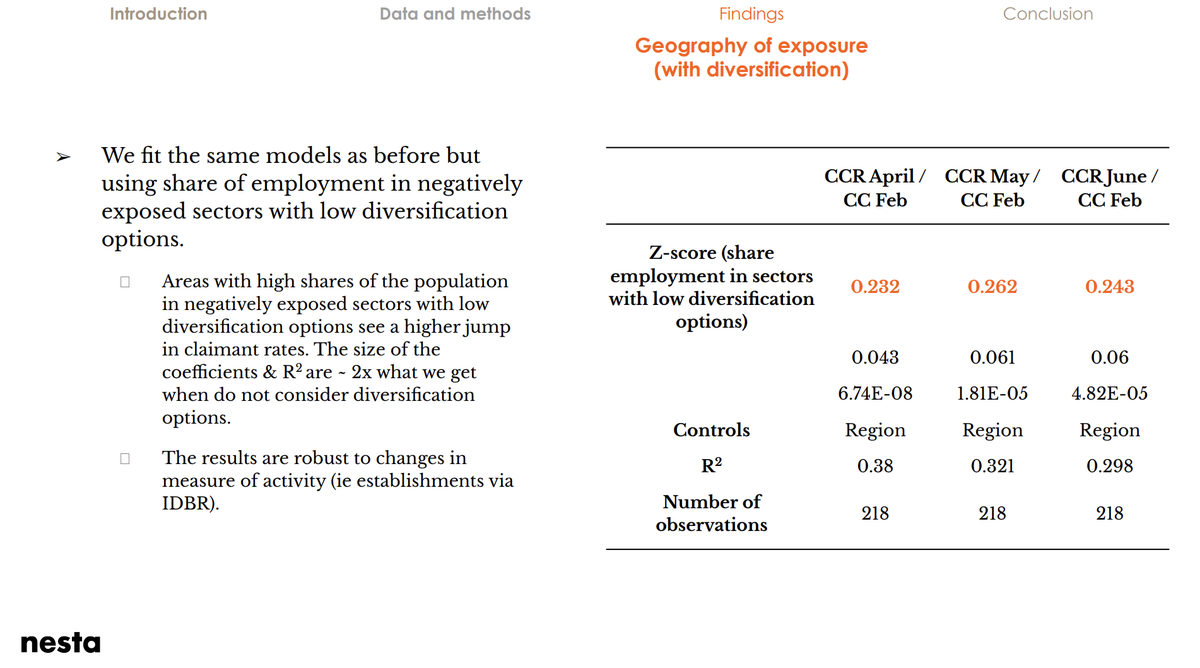
3h. Places with a lot of employment in sectors that are negatively exposed to Covid-19 & have few opportunities for diversification have seen faster growth in claimant rates.
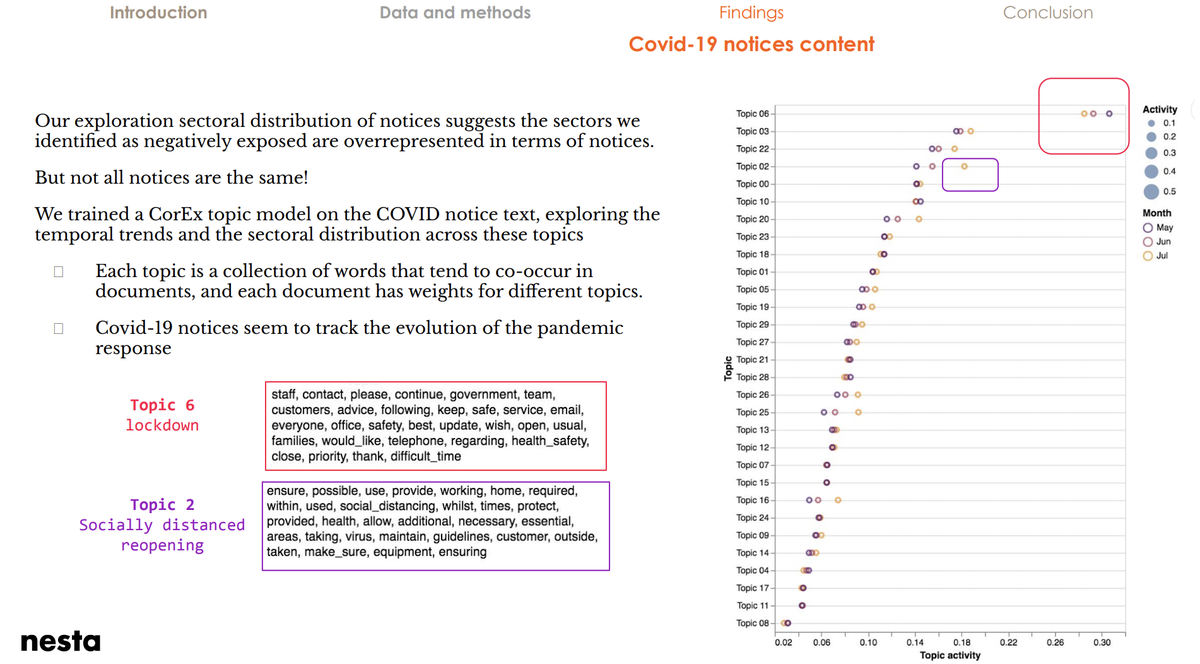
3i. Preliminary results from our analysis of 640k Covid-19 notices suggest that they track the evolution of the pandemic and its policy response, and reveal heterogeneity between businesses inside sectors. Is this linked to differences in adaptability & impacts?
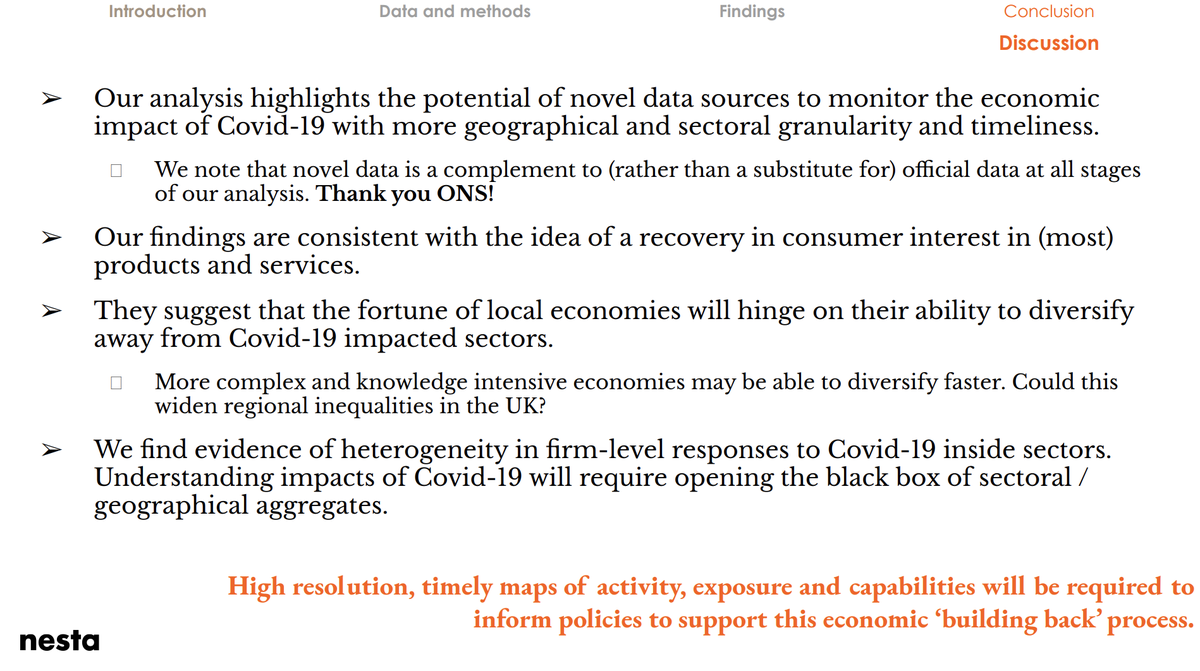
4. Conclusions: Our analysis suggests that rural and coastal areas may be less able to diversify away from Covid-19 bottlenecks to growth than complex economies. This could increase spatial economic inequalities in the UK.
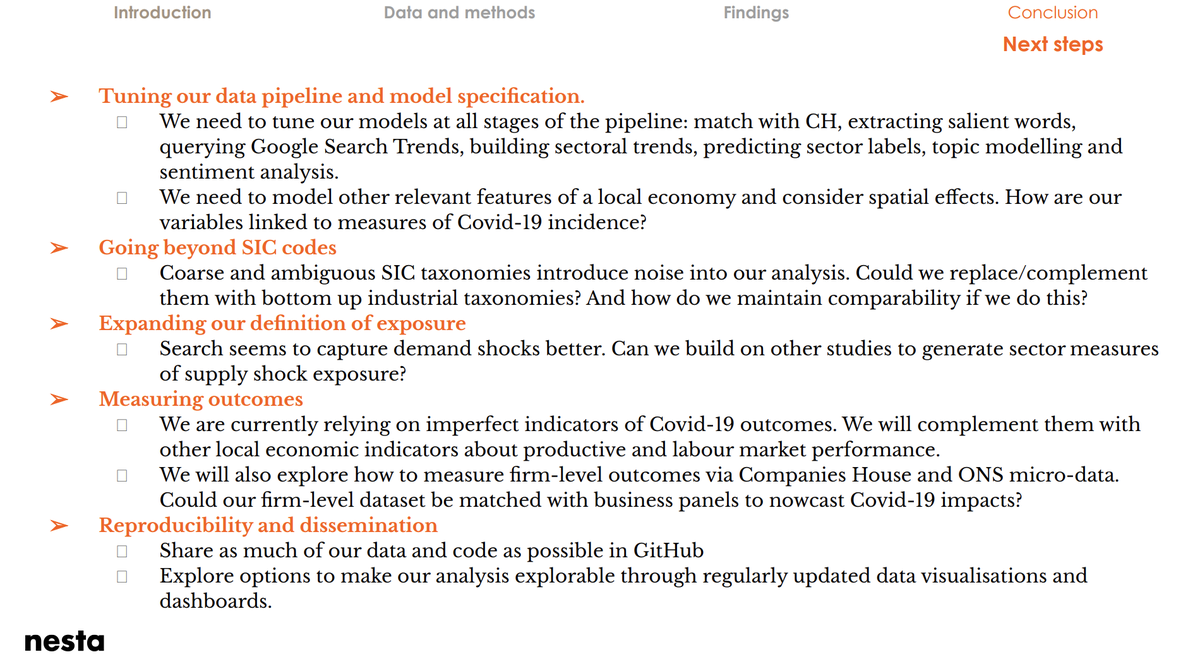
4b. New mixes of web & traditional sources can improve our understanding of Covid-19 impacts. To maximise their value we should disseminate them through interactive visualisations and dashboards enabling better decisions at all levels (#1). See #2 for (many) next steps.
PS. Paper coming later in the year.
PPS. As usual, thank you to open source developers for creating the software infrastructure we use in all our work. All the charts we created rely on the wonderful altair package @jakevdp & collaborators.
PPS. As usual, thank you to open source developers for creating the software infrastructure we use in all our work. All the charts we created rely on the wonderful altair package
 @jakevdp & collaborators.

 Read on Twitter
![3b. What we found (sectors). The search data shows a decline in interest in the usual (social consumption) industries but things are slowly going back to normal. Things don't go back to normal in Arts or Transport though.[] https://nesta-test.s3.eu-west-2.amazonaws.com/escoe_presentation/division_trends.html 3b. What we found (sectors). The search data shows a decline in interest in the usual (social consumption) industries but things are slowly going back to normal. Things don't go back to normal in Arts or Transport though.[] https://nesta-test.s3.eu-west-2.amazonaws.com/escoe_presentation/division_trends.html](https://pbs.twimg.com/media/EdnX8EuXoAEuAxi.png)
