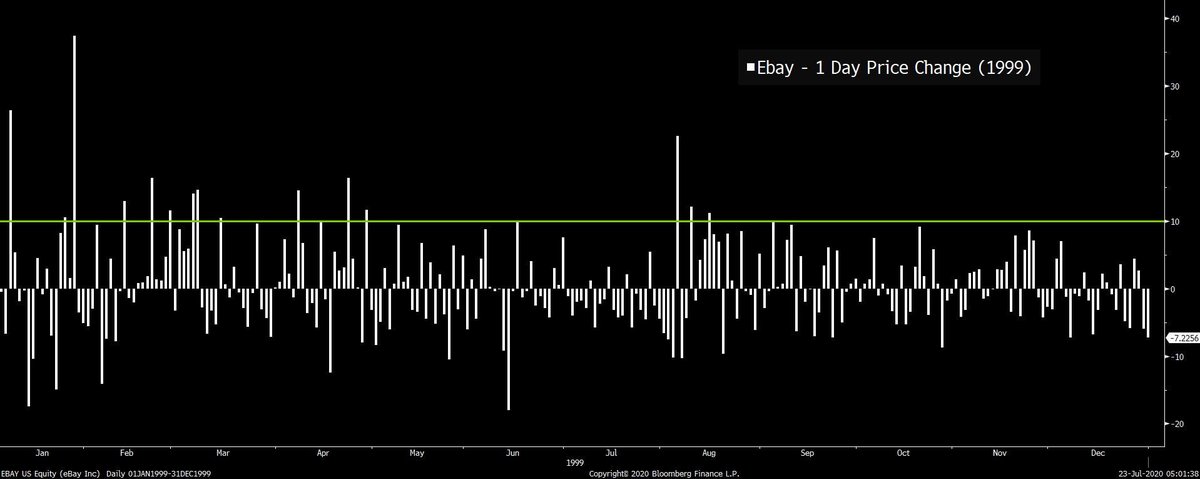
ONE CHART THAT SHOWS HOW CRAZY 1999 WAS
For the @Markets newsletter, I wrote about comparisons between the stock market in 2020 and 1999 and how 1999 was just way crazier. For example, $EBAY had *14* days in 1999 where it rose 10% or more. https://www.bloomberg.com/news/newsletters/2020-07-23/five-things-you-need-to-know-to-start-your-day?sref=vuYGislZ
For the @Markets newsletter, I wrote about comparisons between the stock market in 2020 and 1999 and how 1999 was just way crazier. For example, $EBAY had *14* days in 1999 where it rose 10% or more. https://www.bloomberg.com/news/newsletters/2020-07-23/five-things-you-need-to-know-to-start-your-day?sref=vuYGislZ
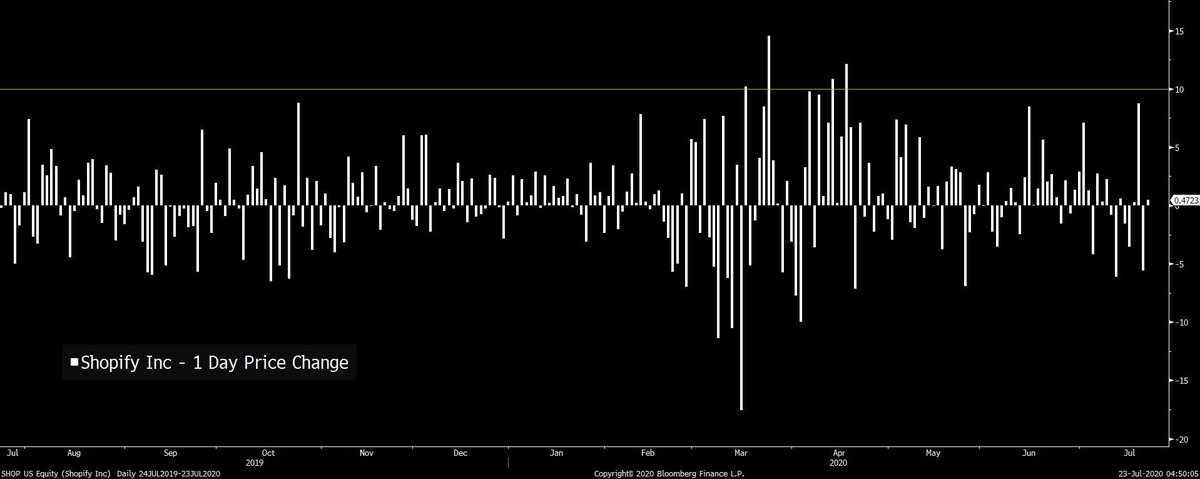
By comparison, $SHOP which is one of this year's mega winners has had just 4 days of 10% or more gains
The relentless grind higher in tech/software names this year has been something to behold. But there's just no comparison to the speed and get-rich-quickness of the market back then. Totally different levels of mania, IMO.
Anyway, whether it's like 1999 or not, that doesn't mean stocks will go up or down. But I think there's a good argument we're just not in the same ballpark.
For more reading, sign up for the @markets newsletter here. http://link.mail.bloombergbusiness.com/join/4wm/markets-signup&hash=b9b2681361bede0e1069ca238efb1ec2
For more reading, sign up for the @markets newsletter here. http://link.mail.bloombergbusiness.com/join/4wm/markets-signup&hash=b9b2681361bede0e1069ca238efb1ec2

 Read on Twitter


