1. Today in Ag Data News. California agriculture is very different from the rest of the country https://asmith.ucdavis.edu/news/we-grow-that
2. California's crop diversity struck me on a recent bike ride near Davis. I looked around and could see seven different crops, not counting the wheat and alfalfa fields that I had passed 5 minutes earlier. Here's the 360° view. http://pnr.ma/akdMUs
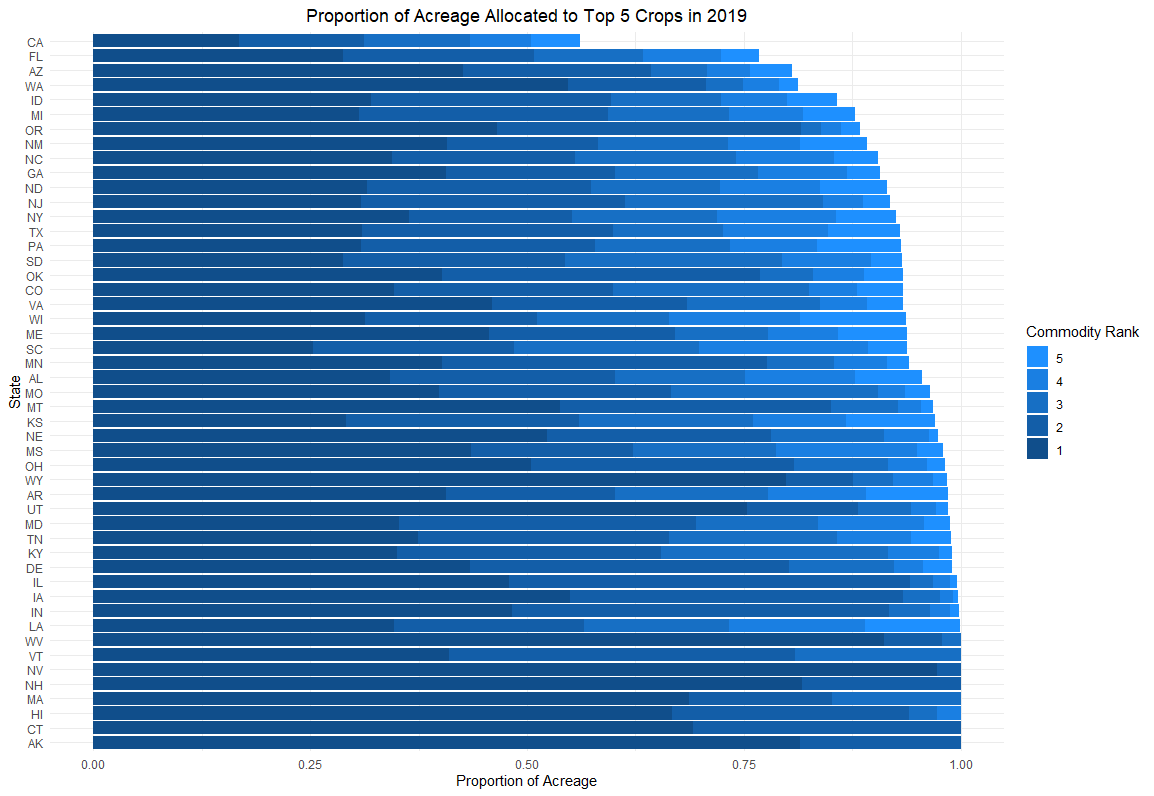
3. This chart shows the percent of acres allocated to the top 5 crops in each US state. The darkest blue component is the percent of acreage used by the top crop, the second darkest is the percent used by the second largest crop, etc.
4. The top 5 CA crops make up just over 50% of acreage. In every other state, the top 5 make up at least 75%. In IA and IL, the top two crops (corn and soybeans) make up over 90% of acres. In NV and WV, the top crop (hay) makes up more than 90% of acres.
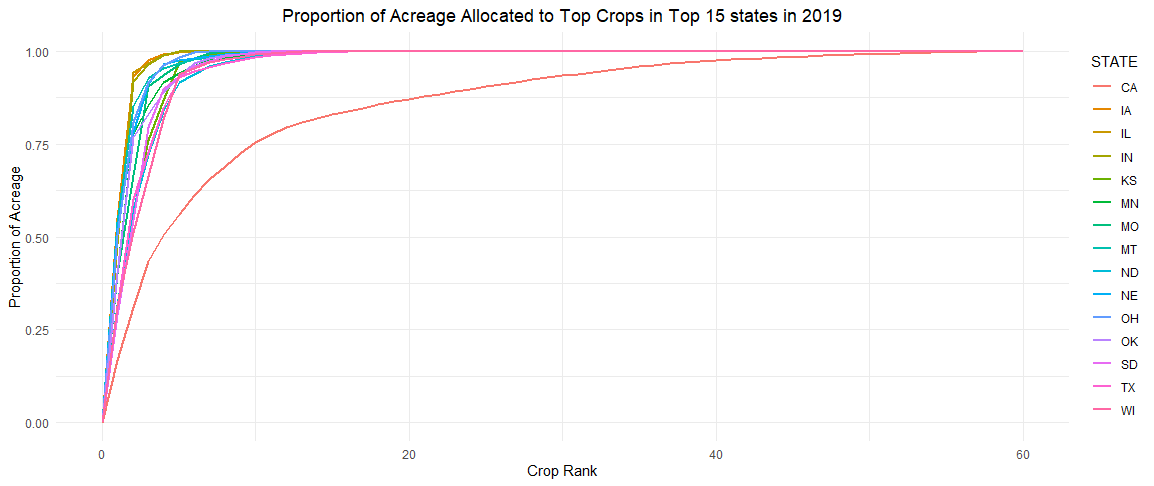
5. This graph shows the proportion of a state's crop acres that were planted to the top crops in 2019. In CA, the top 10 crops make up 75% of the land planted to crops. You have to sum up 43 different crops to accumulate 98% of California acres.
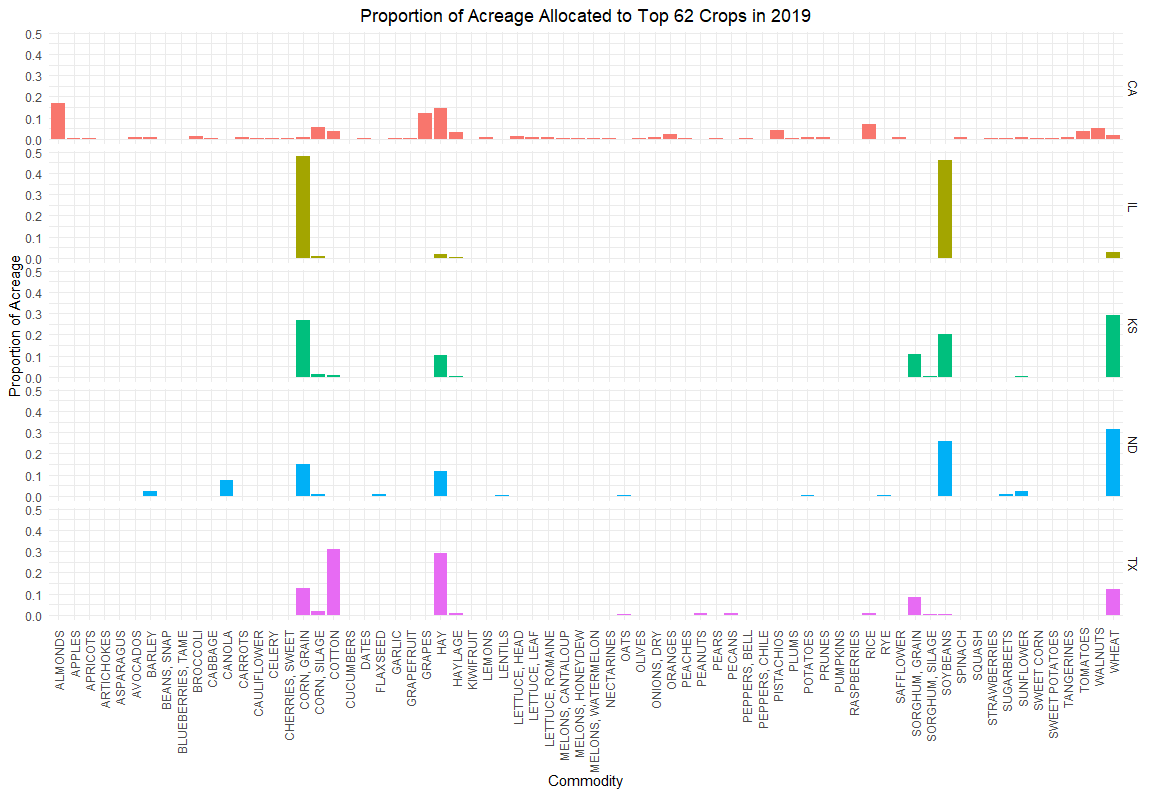
6. In 2019, USDA reported harvested or bearing acreage for 62 different crops. No CA crop makes up more than 20% of acreage and numerous crops each occupy a few percent of acres. Major crops like corn, soybeans, wheat, hay and cotton dominate acreage in the other states.
7. Is this an efficient way to organize American agriculture? If you could allocate crops to farmland around the nation would you assign most of the country to grow the major crops and California to grow the specialty crops?
8. A long growing season, predictable weather, fertile soils, available labor (historically), and plentiful water (for now) means that almost anything grows well in the CA Central Valley. CA producers could likely obtain higher yields than other states for any crop.
9. But, the gap between California and the rest of the country is the most relevant metric for maximizing economic efficiency, and the gap is really large for specialty crops.
10. In short, California has a comparative advantage in specialty crops, and so it makes sense to grow them here. These facts may change as the agricultural labor supply shrinks and water becomes scarcer.
11. Our CA and US apps currently focus on major crops, so they do not contain all these data. However, I created the figures in this article using the same R code that underlies the apps. Code here: https://files.asmith.ucdavis.edu/crop_diversity.R
For more details, here's my article. https://asmith.ucdavis.edu/news/we-grow-that

 Read on Twitter


