THREAD:
After struggling to deal with SJSU's god forsaken é I finally got my code to work, so it is time to dive a little deeper into my mortal enemy's 2019 season
After struggling to deal with SJSU's god forsaken é I finally got my code to work, so it is time to dive a little deeper into my mortal enemy's 2019 season
Step 0: Stat Primer
This thread we'll look mainly at Success Rate (SR) and Expected Points Added (EPA).
SR is how often you gain 40% of Yards to go on 1st down, 60% on 2nd or convert on 3rd/4th. Essentially how efficient you are
EPA measures how impactful a play was
This thread we'll look mainly at Success Rate (SR) and Expected Points Added (EPA).
SR is how often you gain 40% of Yards to go on 1st down, 60% on 2nd or convert on 3rd/4th. Essentially how efficient you are
EPA measures how impactful a play was
Step 1: Sense for the team
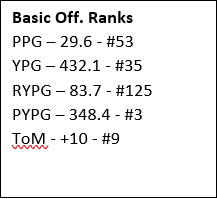
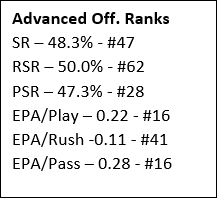
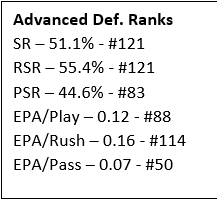
With how they stack up nationally, we can see that SJSU was one of the best passing teams in the nation, didn't pick up many yards rushing but were decently efficient, and didn't play defense.
Obviously, this doesn't tell the full story though
With how they stack up nationally, we can see that SJSU was one of the best passing teams in the nation, didn't pick up many yards rushing but were decently efficient, and didn't play defense.
Obviously, this doesn't tell the full story though
Step 2: Sense for their Season
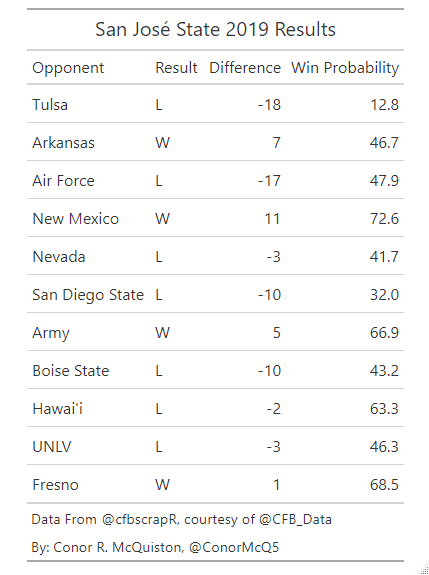
I'm ignoring their opener bc FCS. 1/2 their games were one score games, and per the Post-Game Win Probability they were in the game in 5/7 losses. Their historic upset of Arkansas was more notable bc of that WP, but they also should've beat Hawaii.
I'm ignoring their opener bc FCS. 1/2 their games were one score games, and per the Post-Game Win Probability they were in the game in 5/7 losses. Their historic upset of Arkansas was more notable bc of that WP, but they also should've beat Hawaii.
To explain the Post-Game Win Probability, I have a model which can predict the final score difference based on what happens in the game.
Using that model, I can get a range of potential score differences and get the probability that a team wins given what happened in the game.
Using that model, I can get a range of potential score differences and get the probability that a team wins given what happened in the game.
Step 3: Play Calling
The és were better at passing, so it is probably a good thing that they tended to pass way more than they ran. The amount they did either, however, was within a pretty consistent range throughout the season with no notable spikes.
The és were better at passing, so it is probably a good thing that they tended to pass way more than they ran. The amount they did either, however, was within a pretty consistent range throughout the season with no notable spikes.
It is totally possible that the passing % is inflated in the blowout games (Air Force, Tulsa, Boise, SDSU) since I did not filter for garbage time. Considering the proportion in the close games, I don't think this is the case though. Further analysis is required.
Step 4: Game by Game Offensive Efficiency
The és were generally pretty consistent with Rushing and Passing being roughly as efficient. There is also a clear break after the SDSU game, they were clearly more efficient rushing ans passing after it. Also the Hawaii game was weird
The és were generally pretty consistent with Rushing and Passing being roughly as efficient. There is also a clear break after the SDSU game, they were clearly more efficient rushing ans passing after it. Also the Hawaii game was weird
To theorize why this split might exist:
There may have been a change in play calling philosophy (i.e. personnel groupings, play action, etc)
Different players got more snaps for a better offense
They played worse defenses in this stretch
There may have been a change in play calling philosophy (i.e. personnel groupings, play action, etc)
Different players got more snaps for a better offense
They played worse defenses in this stretch
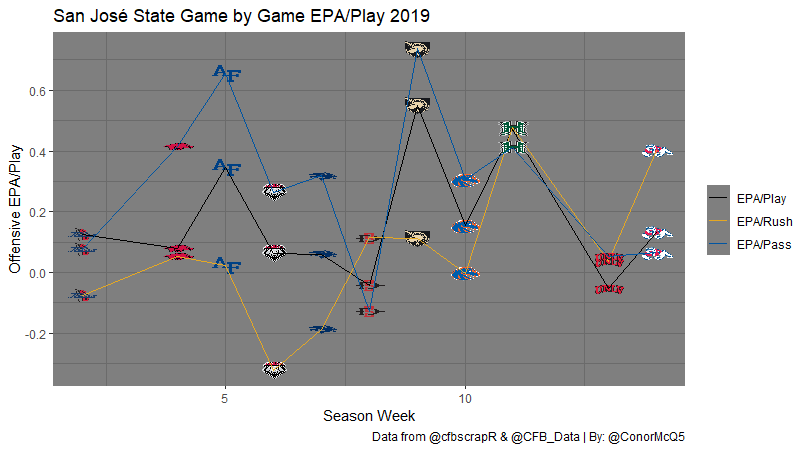
Step 5: Game by Game Offensive Impact
Unsurprisingly, the és were not nearly as consistent in terms of impact. Across the season, however, generally the passing game was much more impactful than running and really impactful overall.
Unsurprisingly, the és were not nearly as consistent in terms of impact. Across the season, however, generally the passing game was much more impactful than running and really impactful overall.
I do want to point out a few oddities though.
The Hawaii game was a shoot out where everything worked for the és but they still lost.
SDSU was the only game where their offense was totally shut down
The Fresno State game was weird as nothing was very efficient, but v impactful
The Hawaii game was a shoot out where everything worked for the és but they still lost.
SDSU was the only game where their offense was totally shut down
The Fresno State game was weird as nothing was very efficient, but v impactful
Step 6: Game by Game Defense
Frankly, whenever the és had to face a half way competent offense their defense crumbled. They were passable against bad teams though (see: Mexico, New and State, Fresno). It is very clearly the team's weakpoint
Frankly, whenever the és had to face a half way competent offense their defense crumbled. They were passable against bad teams though (see: Mexico, New and State, Fresno). It is very clearly the team's weakpoint
So what do we know about the és now?
They can sling the rock
They can run sometimes (maybe they run the same way Mike Leach does)
Boy they can't defend.
The next step is to watch the games (hopefully I can find full games) and break down at a further level
END THREAD
They can sling the rock
They can run sometimes (maybe they run the same way Mike Leach does)
Boy they can't defend.
The next step is to watch the games (hopefully I can find full games) and break down at a further level
END THREAD
As always this would not be possible w out @cfbscrapR and data from @CFB_Data

 Read on Twitter