FLORIDA INFECTION PREVALENCE
Data through 7/18 from @HealthyFla
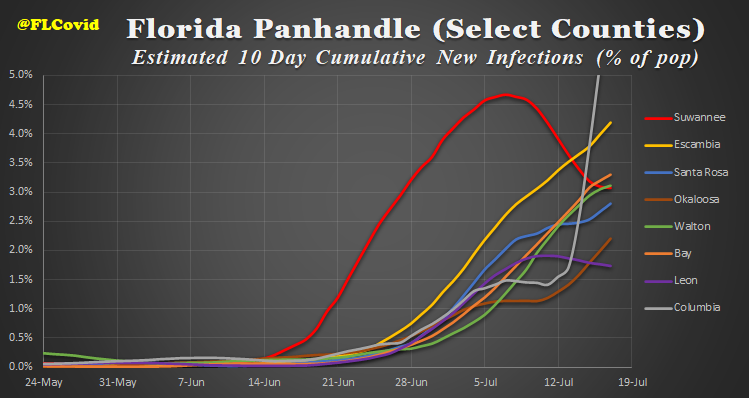
Infection Prevalence is an estimate of the number of *active* infections in a given area
The short version: confirmed cases tell how infections were found, and test positivity indicates how many were *not*
Data through 7/18 from @HealthyFla
Infection Prevalence is an estimate of the number of *active* infections in a given area
The short version: confirmed cases tell how infections were found, and test positivity indicates how many were *not*
Haven't posted these graphs of late, one reason being allowing the apparent backlog of test results to clear, but now that they have, picture is clearer
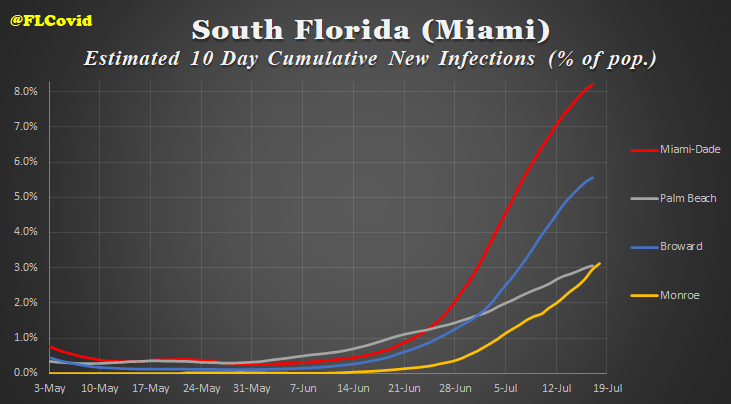
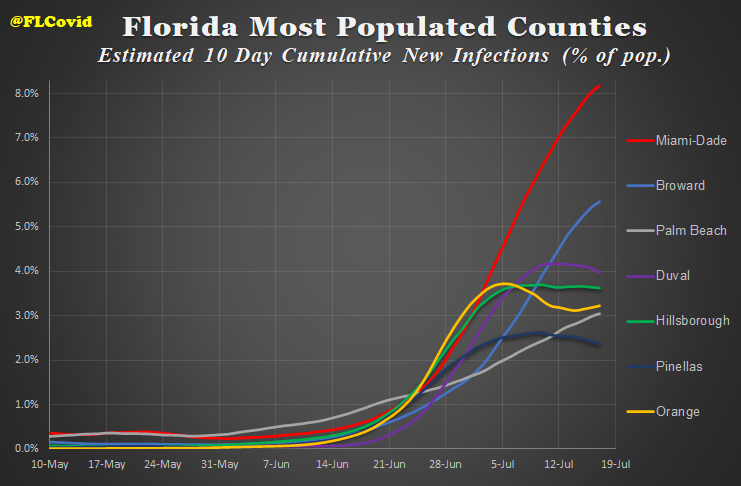
Miami-Dade is by far the highest estimate in the state, breaking even the adjusted scale, and not as of yet leveling off
Miami-Dade is by far the highest estimate in the state, breaking even the adjusted scale, and not as of yet leveling off
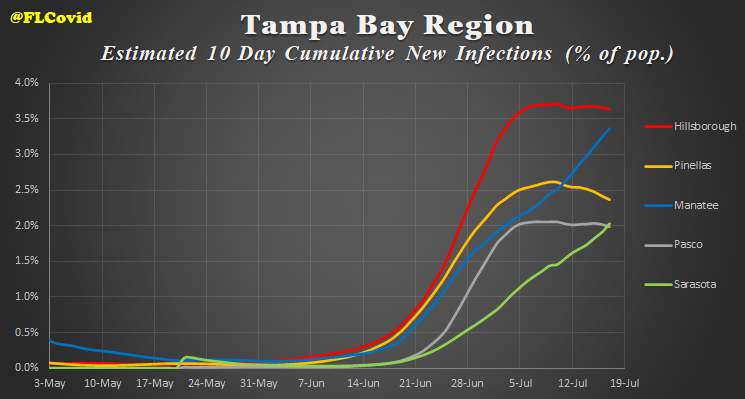
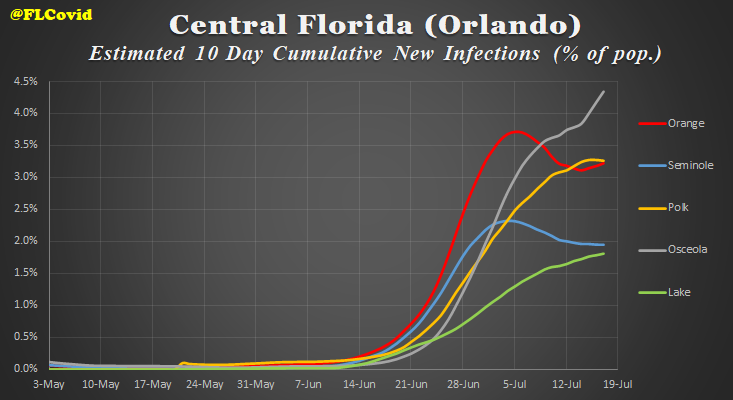
The I-4 Corridor is in better shape, with some clear leveling off and even declines in these counties
However, the descent is gradual, and even Orange County, previously the poster child of success in Florida, is creeping back up
Those trends do not bode well long term
However, the descent is gradual, and even Orange County, previously the poster child of success in Florida, is creeping back up
Those trends do not bode well long term
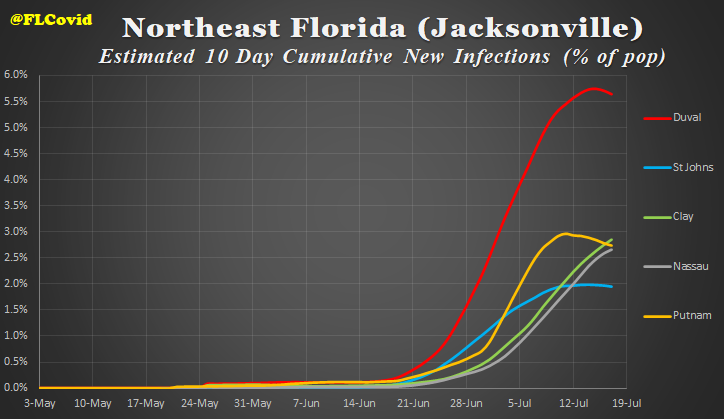
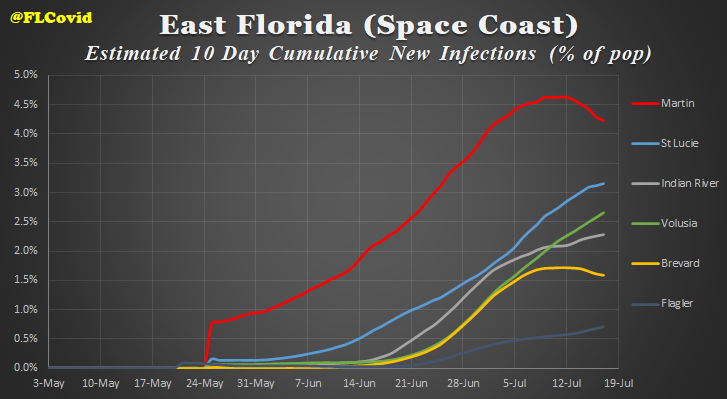
On the East Coast of Florida, Duval is finally showing its curve bending, as is Martin (which may be overstated here), but the rest of the areas are either leveling off continuing to creep upwards
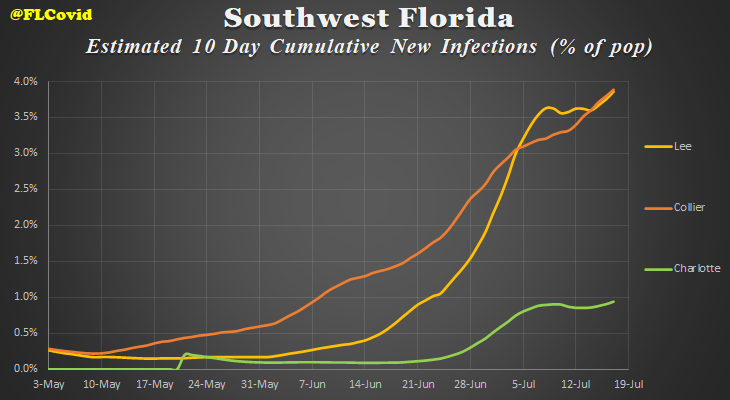
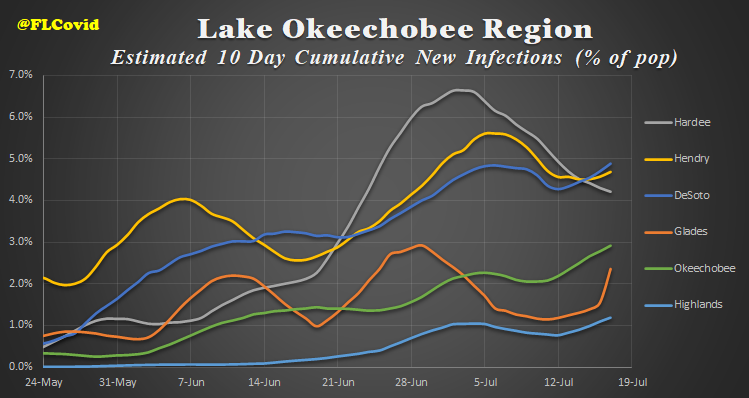
In the lower part of the state, Lee and Collier have made little progress on the Southwest coast, the Okeechobee region has improved, but may be slipping back up (note the higher scale, perhaps inflated due to lower testing volume)

 Read on Twitter