$BTC price continues to move sideways.
Had some time today to build a script to check how frequent these sideway periods are and what usually happens afterwards.
Take these with a grain of salt. But here you go...
TLDR; Good luck trying to time the market
Had some time today to build a script to check how frequent these sideway periods are and what usually happens afterwards.
Take these with a grain of salt. But here you go...
TLDR; Good luck trying to time the market
There are several ways to define a sideways market. My calculation is simple.
I used intervals of 20 days, got the high and the low of this period and checked the percentage difference between them. Code below.
Full code is available in a Jupyter notebook at end of thread.
I used intervals of 20 days, got the high and the low of this period and checked the percentage difference between them. Code below.
Full code is available in a Jupyter notebook at end of thread.
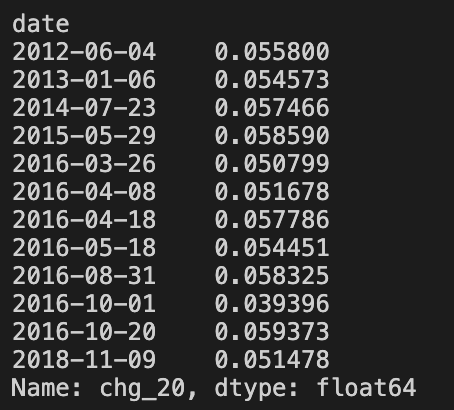
The latest 20 day stats for example are:
Last Range = 5.99%
High = 9471.65
Low = 8935.9
Last = 9198.56
5.99% is low. How low?
99% of the times (since 2010) prices are more disperse than this.
Last Range = 5.99%
High = 9471.65
Low = 8935.9
Last = 9198.56
5.99% is low. How low?
99% of the times (since 2010) prices are more disperse than this.
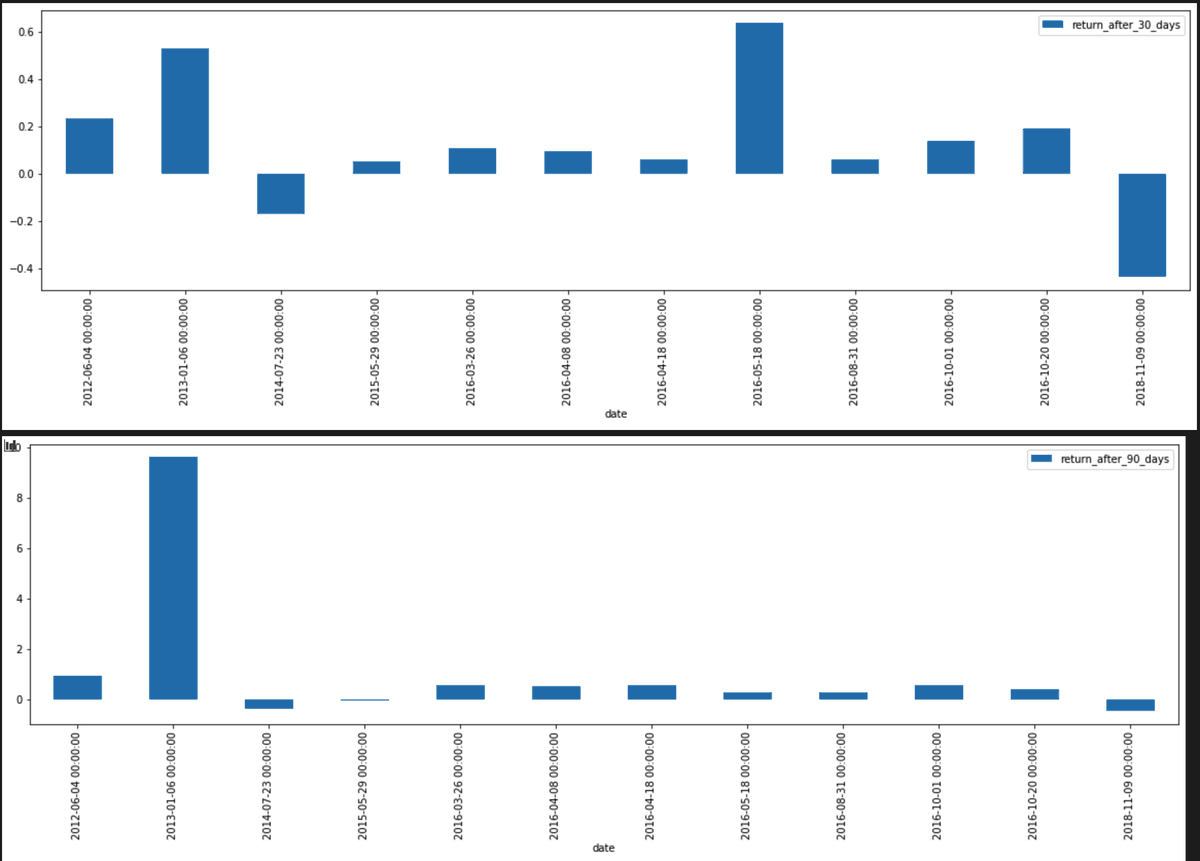
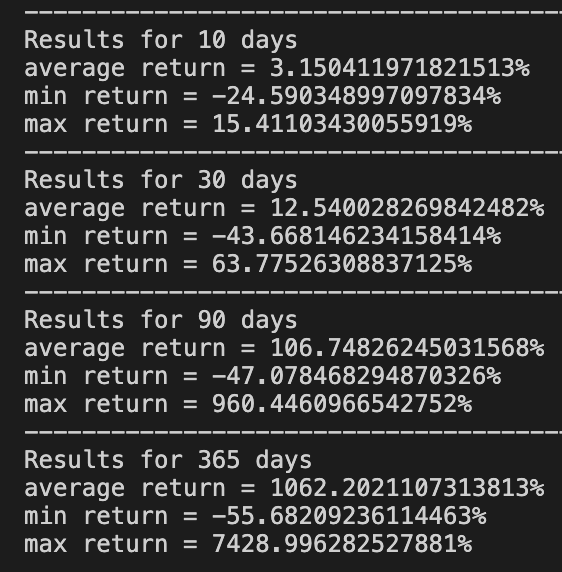
It seems that on average, the low dispersion periods lead to very positive returns. In some cases, the rallies were massive - like in 2016 returning +63%.
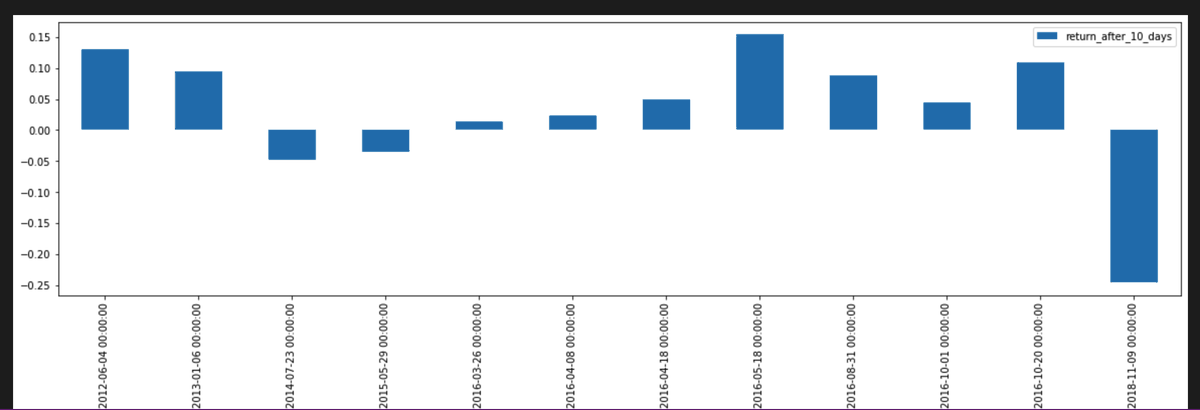
There seem to be 2 exceptions:
. July, 2014
. November, 2018
10 day return chart below for these periods
There seem to be 2 exceptions:
. July, 2014
. November, 2018
10 day return chart below for these periods
This reinforces my thesis that timing $BTC is a losing game. Do it at your own risk. Feel free to play / download / modify the script at the page below. You can change the time periods easily.
https://github.com/pxsocs/btc_calm_storm/blob/master/Bitcoin%20Price%20Analysis.ipynb
https://github.com/pxsocs/btc_calm_storm/blob/master/Bitcoin%20Price%20Analysis.ipynb
Using volatility instead of high / low dispersion https://twitter.com/alphaazeta/status/1284792022365286400?s=20

 Read on Twitter


