Hey guys gonna have a short excess deaths thread comin' in hot in a minute and it's gonna be dire and gloomy and ruin your saturday
So here it is y'all.
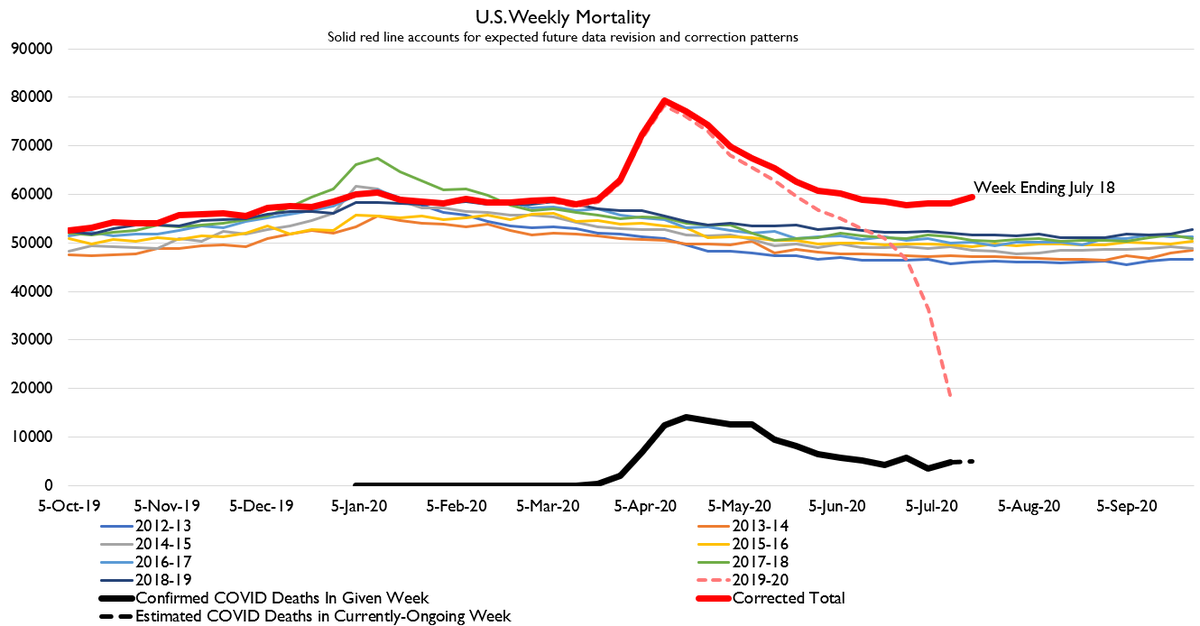
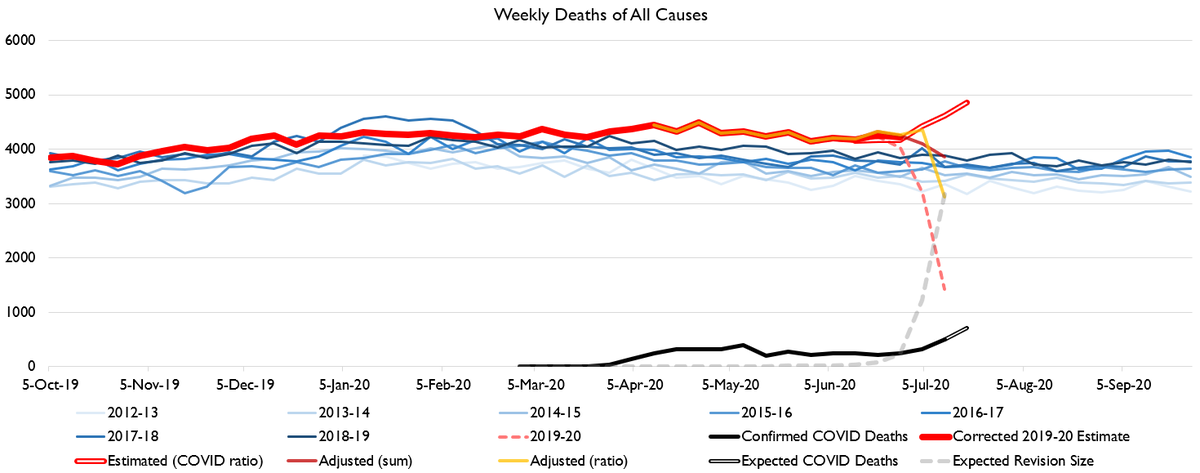
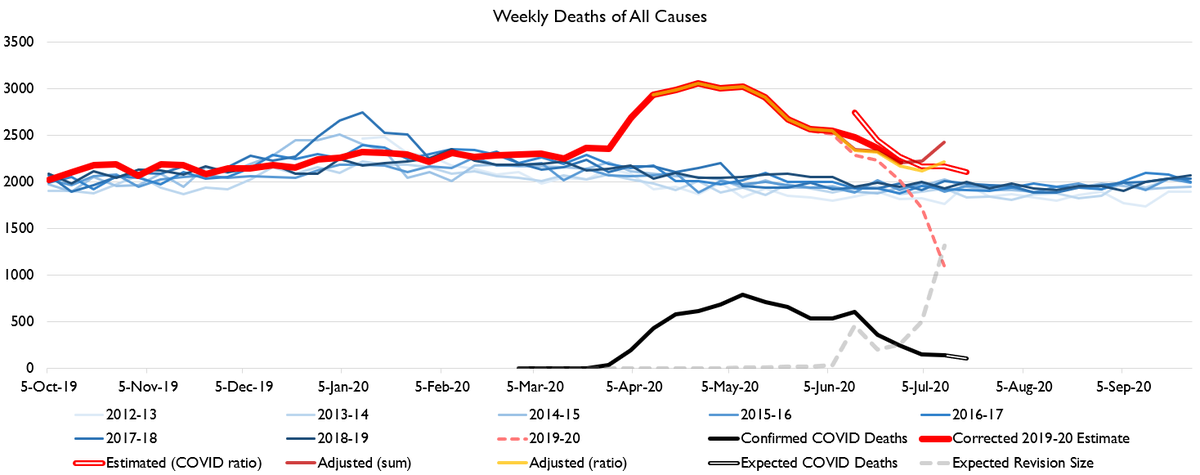
We got a major upward revision in deaths in recent weeks which means my prior forecast that we'd reached normal-ish deaths has been revised into oblivion. Deaths are rising again.
We got a major upward revision in deaths in recent weeks which means my prior forecast that we'd reached normal-ish deaths has been revised into oblivion. Deaths are rising again.
Basically what happened was a bunch of vital stats departments and hospital reporters took a long holiday around July 4 and now they're back and catching up and it's.... not good.
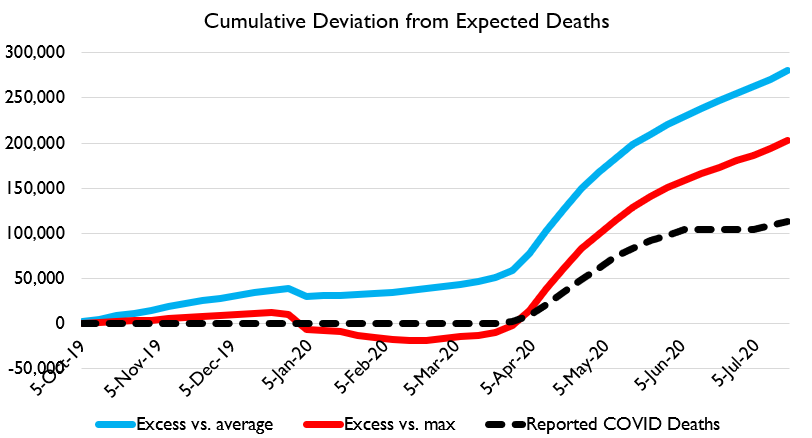
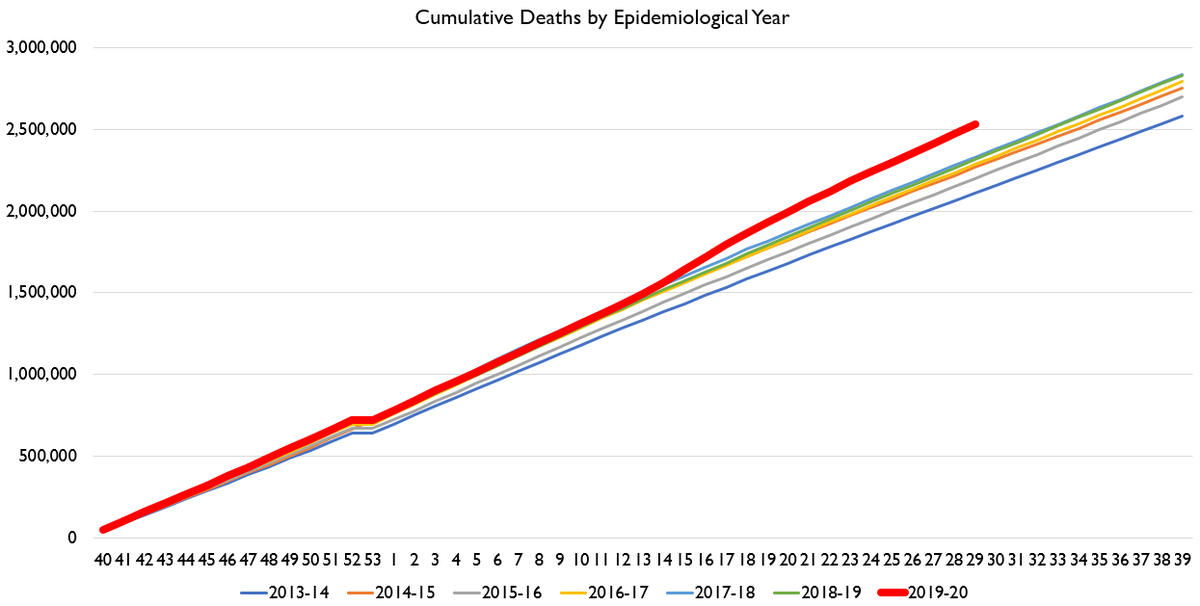
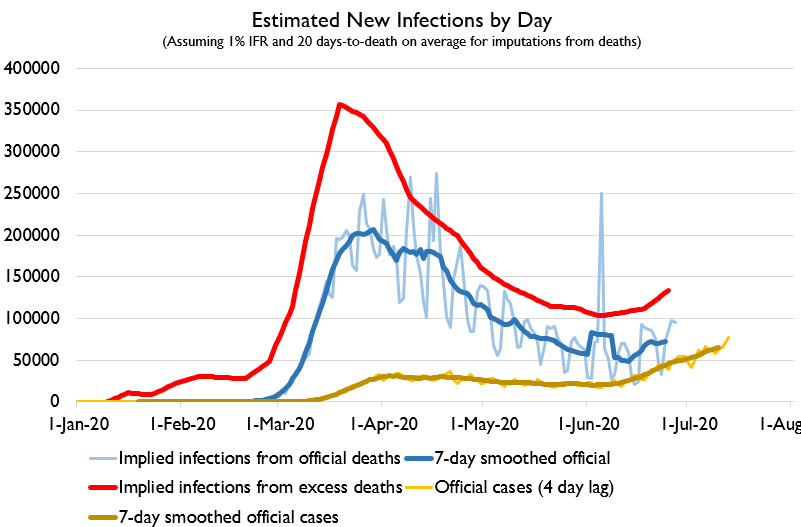
Here's cumulated excess deaths by two different methods. COVID's true death toll is now probably over 200k.
I'm using the data from that report, but which more comprehensive adjustments for undercoverage. https://twitter.com/43blah/status/1284501214730715136
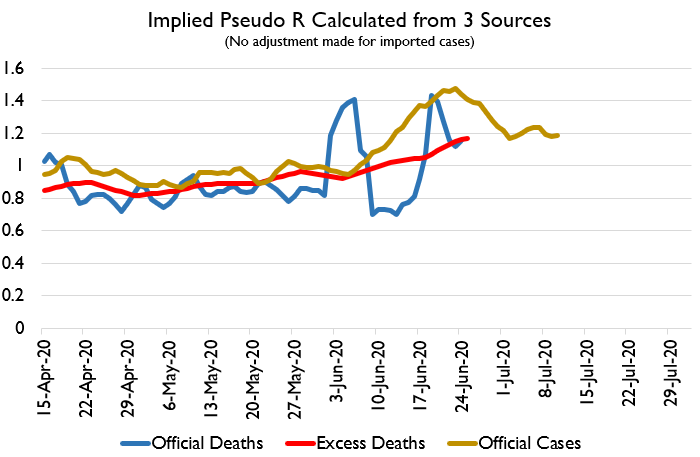
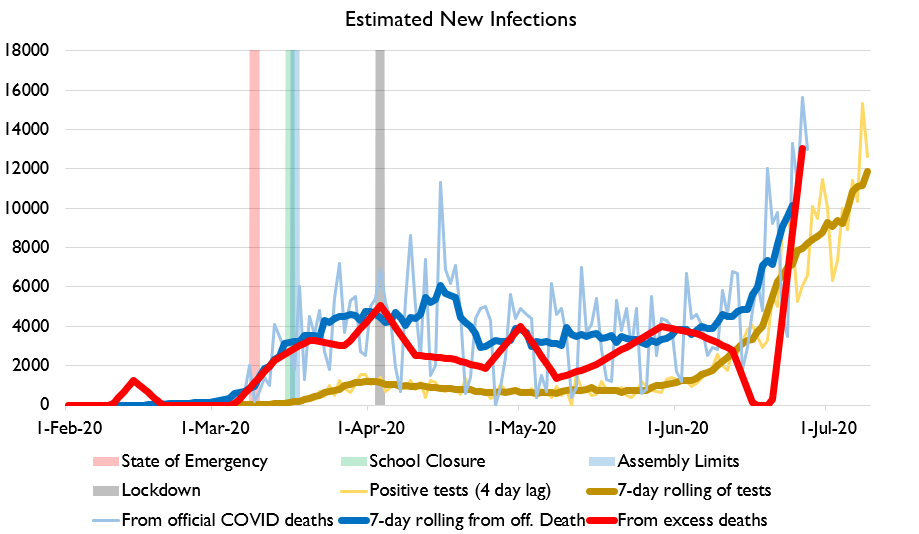
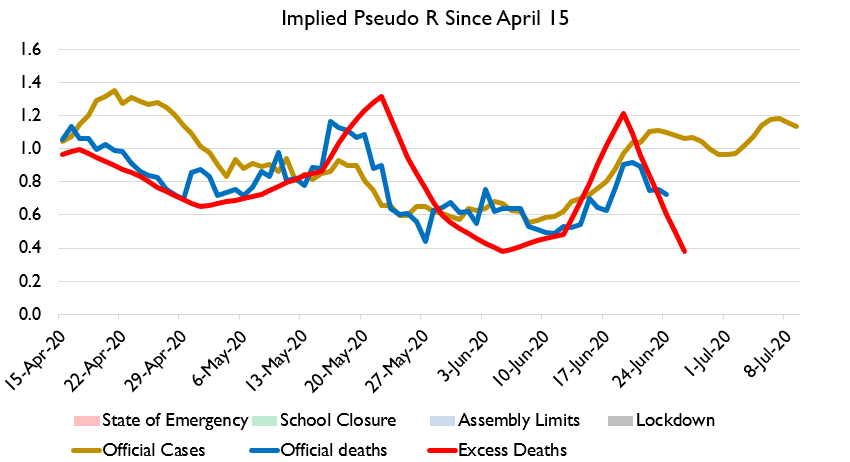
Here's variously estimated cases and R values. All indicators show rising cases and all indicators show >1 R value and all indicators show stable or rising R value which is a way of saying everything is awful.
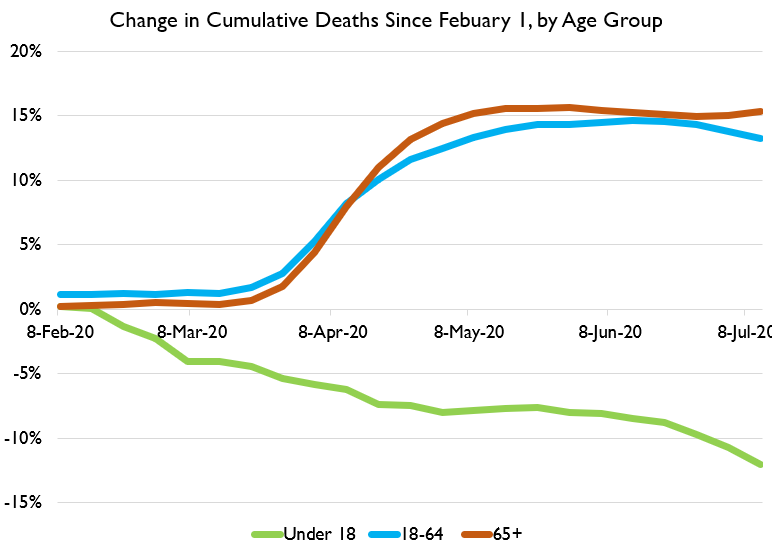
Child deaths are continuing to come in way below prior years, while adult deaths are running very high.
Here I want to remind everyone that I do my best to account for likely future revisions and error patterns, but that my best is highly imperfect. The final values will deviate from my estimates. I'm making a good-faith but imperfect adjustment.
I'll respond to this as I do for all:
The raw data is publicly available on CDC's website.
The threads of graphs are totally uncompensated; nobody pays me for it.
If you want to get the files I spend hours of uncompensated work on, you can compensate me. :)
The raw data is publicly available on CDC's website.
The threads of graphs are totally uncompensated; nobody pays me for it.
If you want to get the files I spend hours of uncompensated work on, you can compensate me. :)
I have no employer paying my salary and can only pay my bills if people buy stuff I make!
Okay. Brunch is served here at the lake cottage in northern Michigan and it's our last full day "quarantining" in a land of endless golden sunsets, cool breezes, and placid waters, so I',m not gonna do any states right now.
In last week's thread I discussed potential causes. I'd boil it down to three things:
1. Fewer car accidents because of less driving
2. Fewer deaths of neglect because parents are at home more
3. Fewer school/childcare-driven clusters of other diseases https://twitter.com/helaineolen/status/1284538566773743616
1. Fewer car accidents because of less driving
2. Fewer deaths of neglect because parents are at home more
3. Fewer school/childcare-driven clusters of other diseases https://twitter.com/helaineolen/status/1284538566773743616
Because some may not have any obvious COVID connection. For example, a person with 3 comorbidities might get COVID, "recover," then 3 weeks later die of a comorbidity, "completely coincidentally" but cmon not actually coincidentally. https://twitter.com/nyyb4life/status/1284537860574642179
What doesn't kill you often leaves you in a weakened state so that something else can finish you off.
A few weeks back I did this thread about mosquito- and tick-related deaths that I think illustrated the issue nicely. https://twitter.com/lymanstoneky/status/1270920252096827393?s=20
A few weeks back I did this thread about mosquito- and tick-related deaths that I think illustrated the issue nicely. https://twitter.com/lymanstoneky/status/1270920252096827393?s=20
All infectious conditions always move through clusters. The thing is right now it's hitting a *lot* of clusters. https://twitter.com/yellingstopAL/status/1284536103618465792
Okay the brunch (goetta, of course) and post-brunch Carcassonne has finished up. As a result I can do a few specific states.
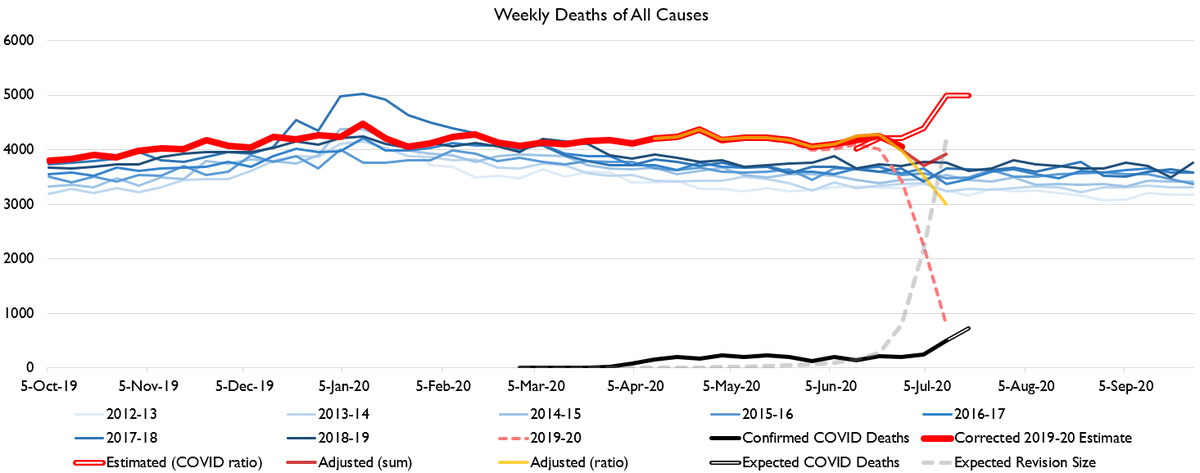
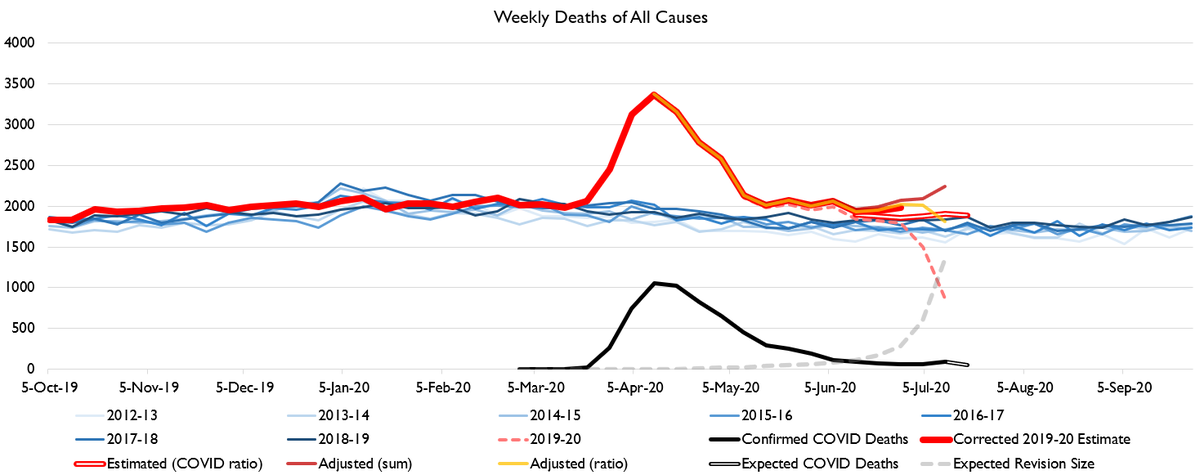
Florida is one I know people are interested in. Florida's deaths are pretty noisy right now and seem likely to rise, but it's still not clear if they actually will.
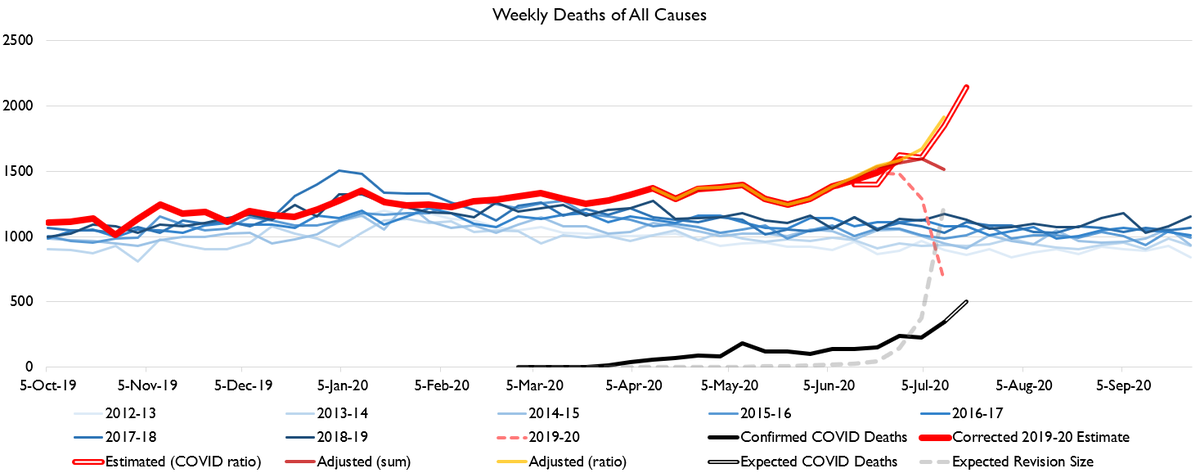
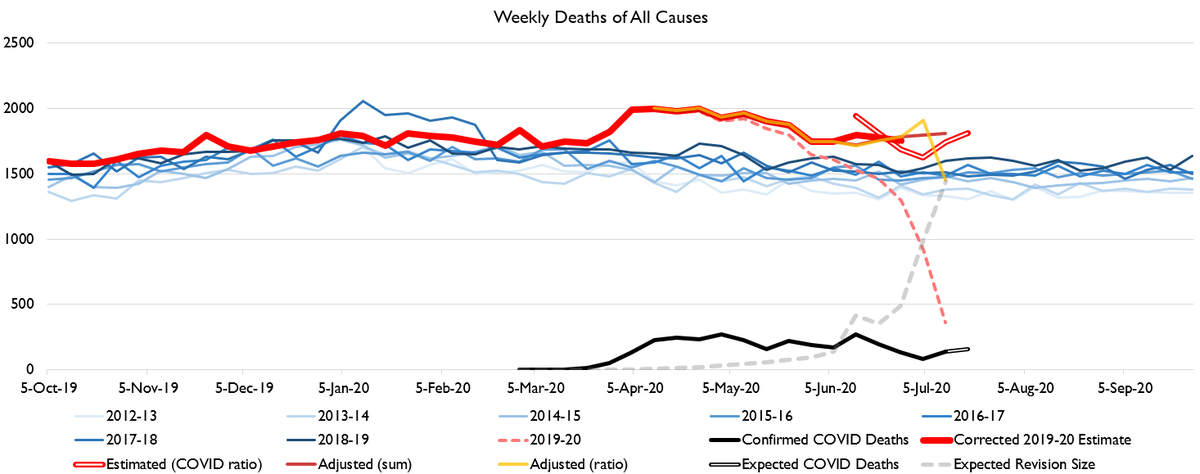
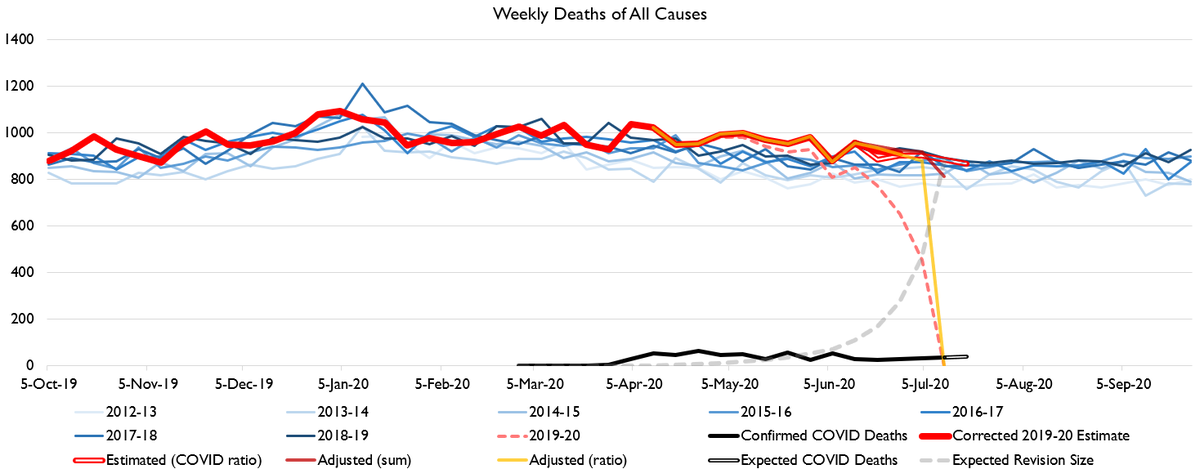
As a reminder I am now showing you more of how the sausage is made: I provide 3 different methods for adjusting for undercoverage in recent weeks. One is based on typical revision sums, one on ratios, and one on official COVID deaths.
Which of these will end up to be most correct is not always clear. I prefer to calculate R and infections from official COVID deaths, with excess deaths used as a "sanity check"
But in terms of which excess death figure will turn out to be most correct.... honestly different estimators have been more correct in different places and times. It's hard to say! The world is complicated!
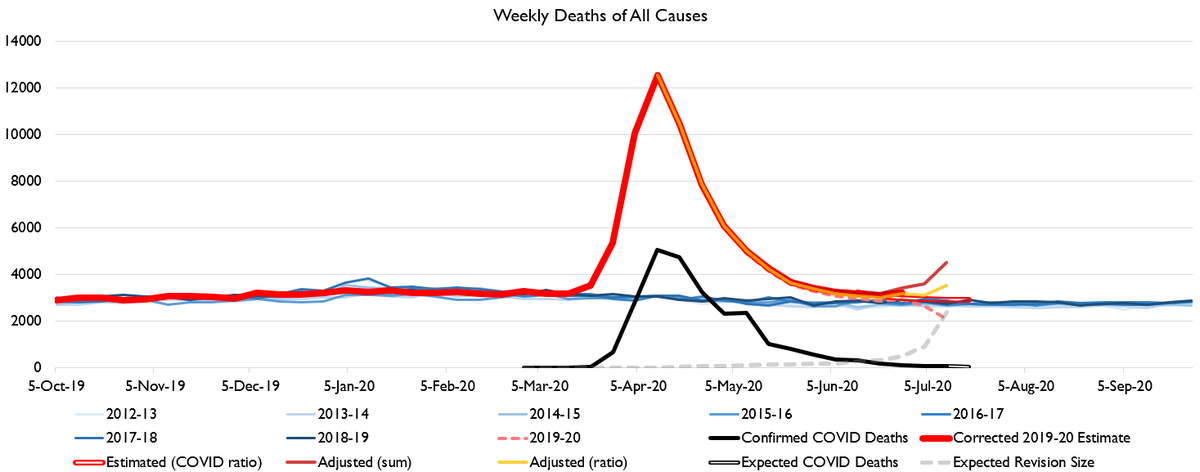
Texas is similarly ambiguous. The "big rise" in deaths is in weeks where we still don't have much data and different revision methods don't really agree. Though the latest "high quality data" still showed a lot of excess deaths.
Note that in Arizona, the different methods absolutely DO agree. So that does suggest that TX/FL excess deaths *may* not come in *quite* as bad as the official death data would imply.
Estimates for Georgia also have approximate agreement: seems like excess deaths in Georgia aren't rising or falling, they're just chugging along. The curve is flat. But curve-flattening was always a stupid rhetorical device and this shows why!
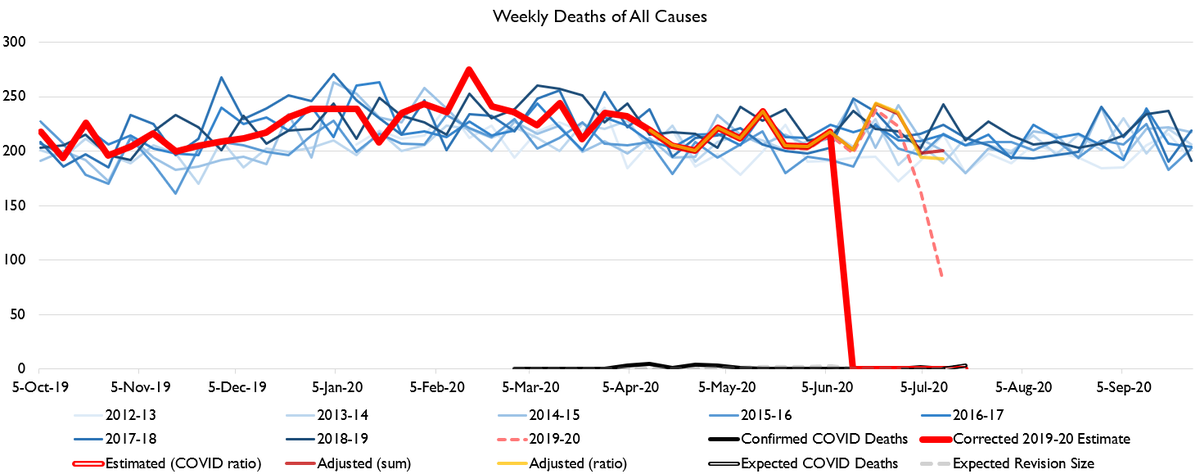
FWIW, in Best America, i.e. God's Commonwealth, i.e. Kentucky, deaths remain at quite normal levels.
Different methods disagree about whether or not Michigan is staying flat at moderate excess deaths, or going for a second wave.
Deaths in NY show the same ambiguity, and never did QUITE return to normal.
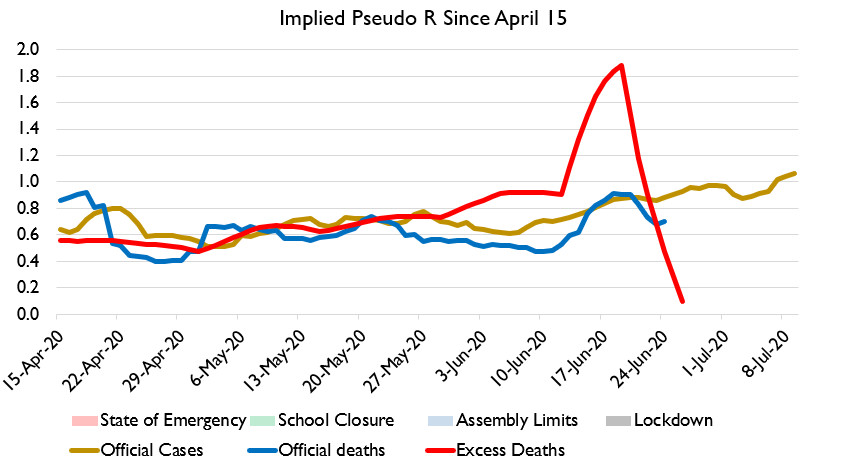
And.... NY's R value has been creeping upwards, and according to official cases is now over 1 again. In a month or two NY could be at full-blown epidemic conditions again.
And.... NY's R value has been creeping upwards, and according to official cases is now over 1 again. In a month or two NY could be at full-blown epidemic conditions again.

 Read on Twitter