Thread
1/7 A regular source of frustration during the #coronavirus epidemic has been how Public Health England (PHE) has reported death figures and how often they are subsequently reported in the media, and disseminated on social media, without context…
1/7 A regular source of frustration during the #coronavirus epidemic has been how Public Health England (PHE) has reported death figures and how often they are subsequently reported in the media, and disseminated on social media, without context…
2/7 A blog published this week by Jason Oke and Carl Heneghan of the Centre for Evidenced Based Medicine @CebmOxford at Oxford University, illustrates clearly how the public too often gets a distorted picture that can cause unnecessary alarm…
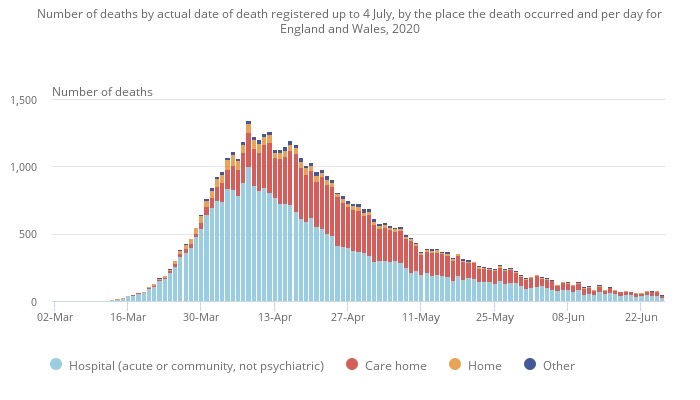
3/7 Office for National Statistics (ONS) data shows COVID-19 deaths, in all settings, peaked at 1,272 on April 8 and have fallen consistently since. This had fallen to 37 by July 1 (that figure could still be added to). The trend has remained consistently down, as illustrated…
4/7 However, as Oke and Heneghan point out, the daily announced figure from PHE includes deaths that have often occurred days, and even weeks, previously. The death is added to the figures when the paperwork is completed, NOT on the day the person dies…
5/7 So even though the cumulative figure is correct, there are wide disparities in the PHE daily headline figures, often impacted by the weekend. For example, say Oke and Heneghan, the figure for July 6 was 16 but the following day this had risen sharply to 152…
6/7 So we have a responsibility in the media to report those figures with context. It avoids the ‘oh my God, the numbers are going up again’ reaction when people see the headline figure without that context...
7/7 Oke and Heneghan estimate current COVID-19 death rates, across all settings, to be around 40 a day. They recommend that if people want an accurate picture of #coronavirus deaths, the ONS is the most accurate source. Here is their blog… https://www.cebm.net/covid-19/an-update-on-ons-death-data-and-how-it-differs-to-phe-daily-updates/

 Read on Twitter


