I haven’t posted a YouGov polling thread for a while, but seven months on from the general election, with the change in Labour leadership and the coronavirus crisis, it's probably about time for another update.
THREAD >
1/19
THREAD >
1/19
Yesterday’s YouGov Westminster vote intention poll also marked three years of VI polling since the dramatic 2017 general election, when UK politics seemed to be switching back to the ‘two party system’, so it's a bit of a milestone for the charts.
https://yougov.co.uk/topics/politics/articles-reports/2020/07/10/voting-intention-con-46-lab-36-8-9-jul
2/19
https://yougov.co.uk/topics/politics/articles-reports/2020/07/10/voting-intention-con-46-lab-36-8-9-jul
2/19
I've tracked the polling across ten key voter groups since 2017, monitoring the changing Conservative and Labour vote intention, and it's led to some pretty dramatic charts during that time (spring-summer 2019 was particularly buttock-clenching for the red and blue teams).
3/19
3/19
It's been a roller-coaster ride over the 3 years, but how is Labour doing across the various key voting groups now?
Is it making inroads into the types of voters it needs, or losing support? Is Labour gaining ground where it may not help the party win the next election?
4/19
Is it making inroads into the types of voters it needs, or losing support? Is Labour gaining ground where it may not help the party win the next election?
4/19
Note 1: The VI results for smaller voting groups, like voters aged 18-24, have a larger margin of error, so those charts tend to be more volatile month-to-month & less reliable, so need to be approached with more caution, but the trends are still worth paying attention to.
5/19
5/19
Note 2: As always, current polling trends cannot be regarded as a ‘prediction’ of future success or failure, even if similar trends have happened in the past, as each individual result, like yesterday's, is only a snapshot of opinion on the days covering that one poll.
6/19
6/19
So what are things looking like now for the two main parties, compared to immediately before the election in December?
https://docs.cdn.yougov.com/ai16ajr8zo/TheTimes_VI_200709_V2_W.pdf
https://d25d2506sfb94s.cloudfront.net/cumulus_uploads/document/itsi0h01ub/TheSundayTimes_VI_Results_191206_w.pdf
7/19
https://docs.cdn.yougov.com/ai16ajr8zo/TheTimes_VI_200709_V2_W.pdf
https://d25d2506sfb94s.cloudfront.net/cumulus_uploads/document/itsi0h01ub/TheSundayTimes_VI_Results_191206_w.pdf
7/19
1. Voted Conservative at the last GE:
95% of those who voted Conservative in December are staying loyal, while 2% would now vote Labour.
No signs of the large number of Con-to-Lab defections required to turn many blue seats red, continuing a 3 year trend.
8/19
95% of those who voted Conservative in December are staying loyal, while 2% would now vote Labour.
No signs of the large number of Con-to-Lab defections required to turn many blue seats red, continuing a 3 year trend.
8/19
2. Voted Labour at the last GE:
88% say they'd vote Labour now, while 5% would vote Conservative.
Labour's overall vote share of 36% is boosted by 27% of 2019 Lib Dem voters who say they'd vote Labour now (not good news for several Lib Dem MPs).
9/19
88% say they'd vote Labour now, while 5% would vote Conservative.
Labour's overall vote share of 36% is boosted by 27% of 2019 Lib Dem voters who say they'd vote Labour now (not good news for several Lib Dem MPs).
9/19
3. EU referendum Leave voters:
Con: 76%, Lab: 12%.
This is actually a bigger lead (64%) for the Conservatives than in the final pre-GE poll (55% lead), suggesting that 'Red Wall' defectors, or leave voters generally, haven't yet warmed to the new Labour leadership.
10/19
Con: 76%, Lab: 12%.
This is actually a bigger lead (64%) for the Conservatives than in the final pre-GE poll (55% lead), suggesting that 'Red Wall' defectors, or leave voters generally, haven't yet warmed to the new Labour leadership.
10/19
4. EU referendum Remain voters:
Con: 22%, Lab: 55%.
A comfortable 33% lead for Labour, up from a 30% lead and 48% vote share in December, boosted no doubt by those Lib Dem voters now considering Labour.
Similar to the Labour lead during last 6 months of 2017.
11/19
Con: 22%, Lab: 55%.
A comfortable 33% lead for Labour, up from a 30% lead and 48% vote share in December, boosted no doubt by those Lib Dem voters now considering Labour.
Similar to the Labour lead during last 6 months of 2017.
11/19
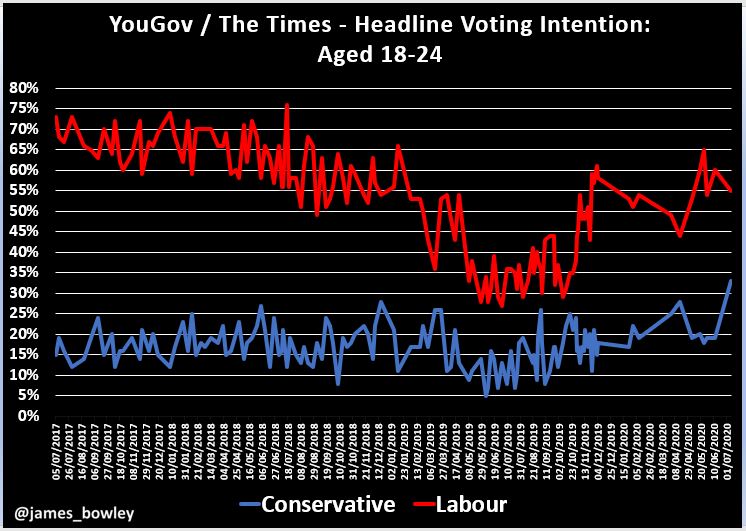
5. Aged 18-24
Con: 33%, Lab: 55%.
Always a volatile group, but this is the highest vote share for the Tories in 3 years, and an unusually small Labour lead, especially compared to the 6 months after the 2017 GE, when the lead averaged 50%.
12/19
Con: 33%, Lab: 55%.
Always a volatile group, but this is the highest vote share for the Tories in 3 years, and an unusually small Labour lead, especially compared to the 6 months after the 2017 GE, when the lead averaged 50%.
12/19
6. Aged 65+
Con: 66%, Lab: 21%
Despite the Covid-19 crisis, the Tories maintain a healthy 45% lead, slightly down from the 50% lead before the GE in December.
Labour is making some inroads, now averaging over 20% vote share for the first time in 18 months.
13/19
Con: 66%, Lab: 21%
Despite the Covid-19 crisis, the Tories maintain a healthy 45% lead, slightly down from the 50% lead before the GE in December.
Labour is making some inroads, now averaging over 20% vote share for the first time in 18 months.
13/19
7. Social grades ABC1:
Con: 43%, Lab: 37%
A 6% Tory lead now, similar to the 5% lead in December, but the lead has narrowed sharply in recent months.
This compares to an average 2% lead for Labour in the 6 months following the 2017 GE.
14/19
Con: 43%, Lab: 37%
A 6% Tory lead now, similar to the 5% lead in December, but the lead has narrowed sharply in recent months.
This compares to an average 2% lead for Labour in the 6 months following the 2017 GE.
14/19
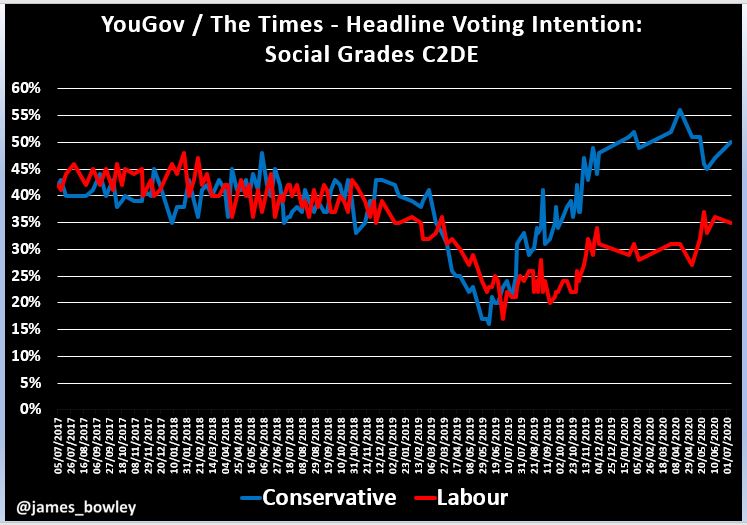
8. Social grades C2DE:
Con: 50%, Lab: 35%
A 15% lead for the Tories with working class voters now, compared to a 17% lead in December, as Labour's share has increased from 31% at that time.
Another larger recent lead of 20%+ has also narrowed.
15/19
Con: 50%, Lab: 35%
A 15% lead for the Tories with working class voters now, compared to a 17% lead in December, as Labour's share has increased from 31% at that time.
Another larger recent lead of 20%+ has also narrowed.
15/19
9. Male voters:
Con: 46%, Lab: 35%
An 11% lead now, down from 15% in December, and from an average of over 20% in Apr-May, compared to fairly neck-and-neck for the 6 months after GE2017.
16/19
Con: 46%, Lab: 35%
An 11% lead now, down from 15% in December, and from an average of over 20% in Apr-May, compared to fairly neck-and-neck for the 6 months after GE2017.
16/19
10. Female voters
Con: 46%, Lab: 38%
A 6% Tory lead, from 4% in December, compared to an average 7% Labour lead in the 6 months after GE2017.
Labour vote share averaging 36% since Starmer became leader versus 29% during the previous 6 months.
17/19
Con: 46%, Lab: 38%
A 6% Tory lead, from 4% in December, compared to an average 7% Labour lead in the 6 months after GE2017.
Labour vote share averaging 36% since Starmer became leader versus 29% during the previous 6 months.
17/19
These are obviously just 'what' is happening, rather than 'why', but let the speculation commence.
Should Labour be encouraged by these numbers, or disappointed, considering the change in leadership and current events?
This is what EC makes of the latest poll
18/19
Should Labour be encouraged by these numbers, or disappointed, considering the change in leadership and current events?
This is what EC makes of the latest poll
18/19
Obviously it's early days for the new Labour leadership, and these are volatile times, with nearly 200 weeks before the next scheduled general election, so there will undoubtedly be many ups and downs in these charts, but I'll try to keep them updated in the years ahead.
19/19
19/19

 Read on Twitter


