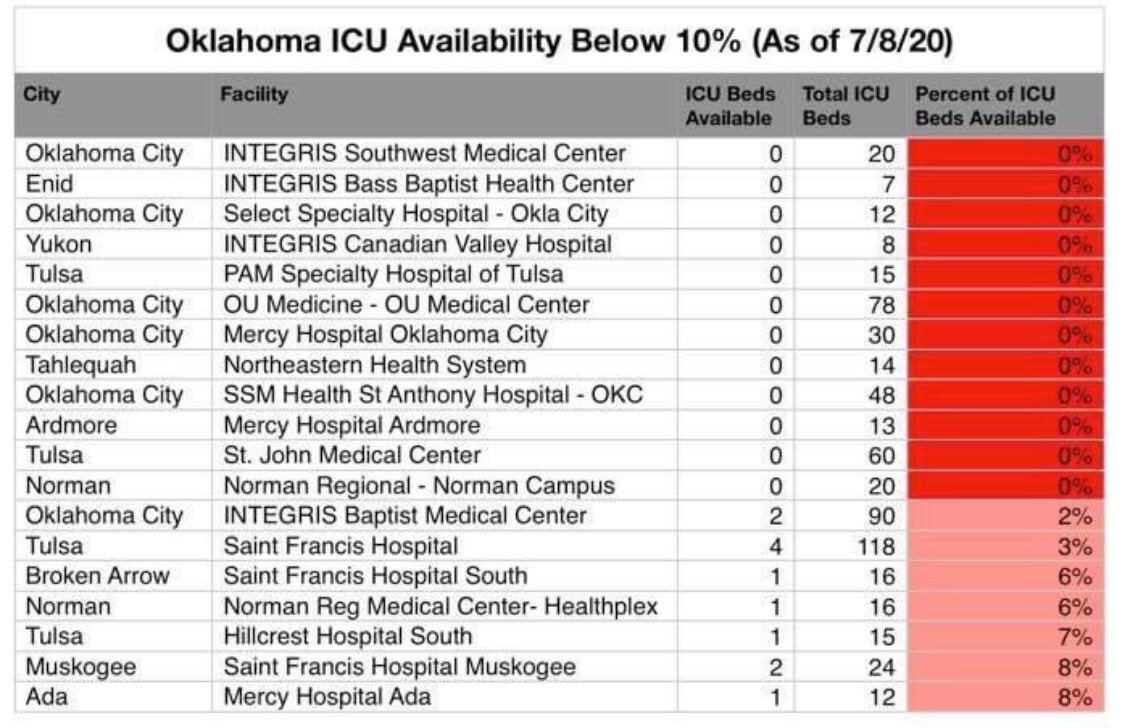
Data—it’s a funny thing. How it’s parsed, what is emphasized, and how it’s formatted, can make all the difference in the takeaway. I received a panicked text from a friend in Oklahoma earlier today over the imminent collapse of the ICU system under COVID. This chart was included.
I haven’t done any real analysis since the early days of the outbreak but this chart was disconcerting. Who wouldn’t be concerned? <10% ICU beds left in the entire state—that’s a problem! But I found it hard to accept something so alarming without first verifying the data.
Before I continue let me be clear about something: this is an idiosyncratic thread about specific data for a specific state. This IS NOT a value judgement on the broad severity of COVID as under/over exaggerated. It IS NOT a commentary on policy. Now that’s out of the way...
All of my data was sourced from the OK Dept of Health Executive Order Reports (linked). A cursory glance at the broad data shows that cases began increase in mid-June. But what I care about is Active Cases. https://coronavirus.health.ok.gov/executive-order-reports
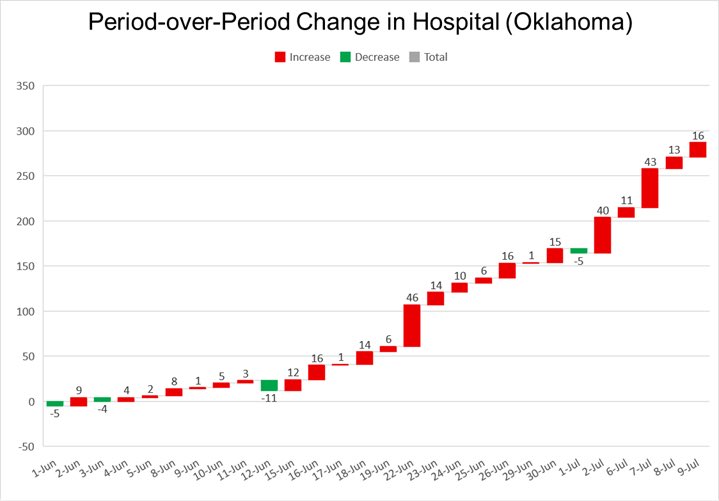
Active Cases bottomed at the end of May around 700. Likewise, COVID Hospitalizations and In ICU bottomed the first few days of June, around 70 & 45, respectively. Since then, Oklahoma has seen an upturn in all of those metrics. Active Cases have increased by ≈3200
COVID patients hospitalized have increased by ≈300; patients in ICU by ≈140. Now available ICU beds in early June were ≈225—maybe the state is “dangerously low” on ICU beds! Or is it?
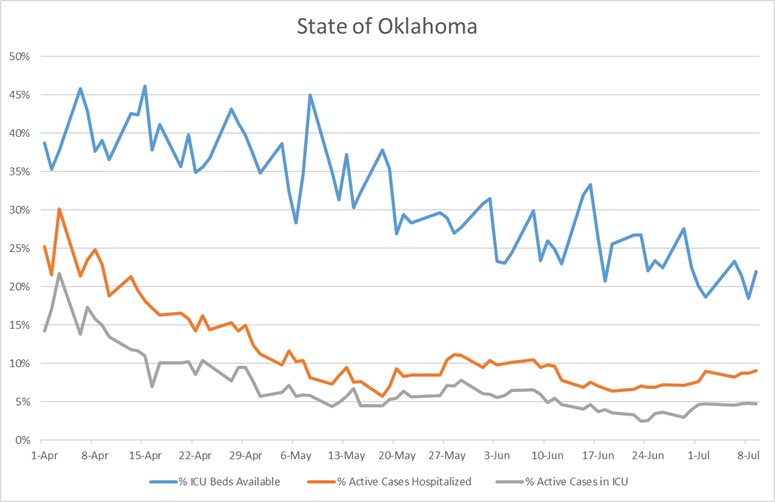
Looking at the availability of beds we see that the state has.... 228 available ICU beds. This has steadily trended down from roughly 400 in April. What gives? One possibility was that people actively avoided going to the hospital for non-COVID emergencies.
It’s also possible that doctors avoided putting non-COVID patients in the ICU as long as possible, anticipating a surge. This is a topic for another time, but it’s interesting to observe because ICU availability decreased as COVID ICU use decreased. See graph on next tweet.
The state currently (07/09) stands at 3986 Active Cases, 361 hospitalizations, and 188 in ICU. Nearly a 6-fold increase in Active Cases in <45 days, and a 4 to 5 fold increase in hospitalizations and ICU patients. Now I can already hear some of you, “But Art, the lag!”
Yes, there is a lag. Calculating that lag is outside the scope of my current analysis. But we can look at some back-of-the-envelope numbers to get a approximate feel for things. ICU needs as a % of active cases seem to have stabilized around 5%.
In order to nearly fill the remainder of the ICU beds, ceteris paribus, Active Cases would need to rapidly approach 8000. This is entirely possibly, of course, considering the exponential compounding potential of this disease.
So, are things “terribly dire” in Oklahoma, as my friend inquired? Well, that all depends on how you measure things! Is the situation worse than a month ago? Undoubtedly. Is hospital sampling and extrapolation a good way to get a handle on the immediate situation? No.

 Read on Twitter


