In yesterdays live session in the trading lab we covered a number of topics
But one of the best one was that the magic isn't in the indicator it is in what the indicator is telling us about the characteristics of that market
a thread...
But one of the best one was that the magic isn't in the indicator it is in what the indicator is telling us about the characteristics of that market
a thread...
There are basically 2 types of markets
Trending and mean reverting
A market is either trending up/down or reverting back to the median (sideways)
Trending and mean reverting
A market is either trending up/down or reverting back to the median (sideways)
Markets fail to breakout and trend 80% of the time
Or breakouts that follow through and become trends only happen about 20% of the time
But when they do they can go a lot longer and a lot further than most expect or believe is possible
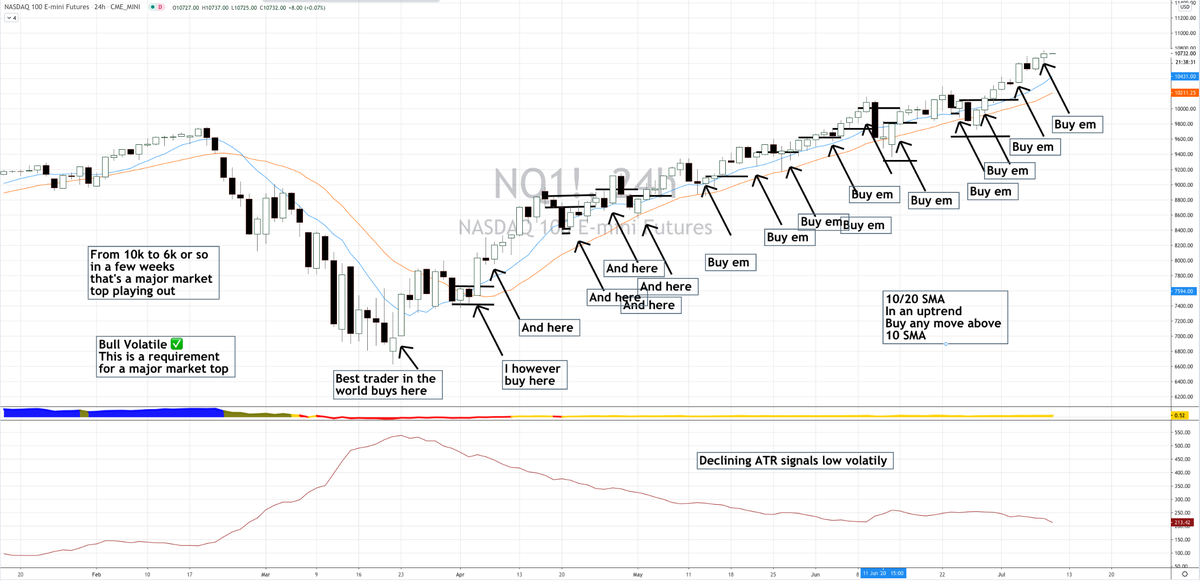
$NQ for example here
Or breakouts that follow through and become trends only happen about 20% of the time
But when they do they can go a lot longer and a lot further than most expect or believe is possible
$NQ for example here
$AMZN here It spent a lot of time trying to breakout through 2019, but 2020 is a completely different story
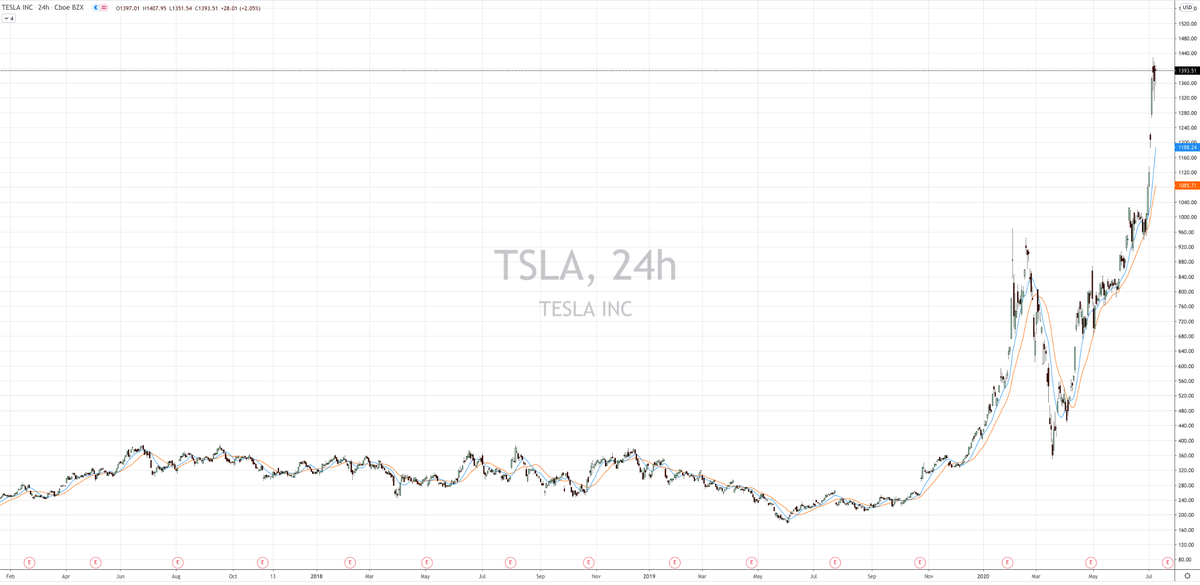
$TSLA is another great example, it goes sideways for a long time breaking out and reverting, but when it finally goes, it goes much further than anyone expects
The other end is true, markets can mean revert/fail to breakout and trend, for much longer than most people expect
and $BTC is a great example of that, while everyone is calling for $100k Bitcoin, it still bangs around that 10k level longer than most expected
and $BTC is a great example of that, while everyone is calling for $100k Bitcoin, it still bangs around that 10k level longer than most expected
So knowing this information you can either have a strategy to trade only breakouts that trend
Or a strategy that finds breakouts that fail and revert to the mean
These are the two type of setups that all setups are built around
Or a strategy that finds breakouts that fail and revert to the mean
These are the two type of setups that all setups are built around
Matching the strategy to the regime (trending or mean reverting) gives you an edge that most traders overlook
They force a strategy to apply it to all markets
And this is why indicators get you into trouble thinking that you need to focus on finding the best combo of indicators
They force a strategy to apply it to all markets
And this is why indicators get you into trouble thinking that you need to focus on finding the best combo of indicators
It should be the other way around, identify the regime (trending/mean reverting) and match an appropriate indicator to that regime
And this is where the pandora box gets opened about KNOWING what your indicator is telling you
And this is where the pandora box gets opened about KNOWING what your indicator is telling you
Some indicators can be used for both trade types (trending/mean reverting) but they need to be used differently
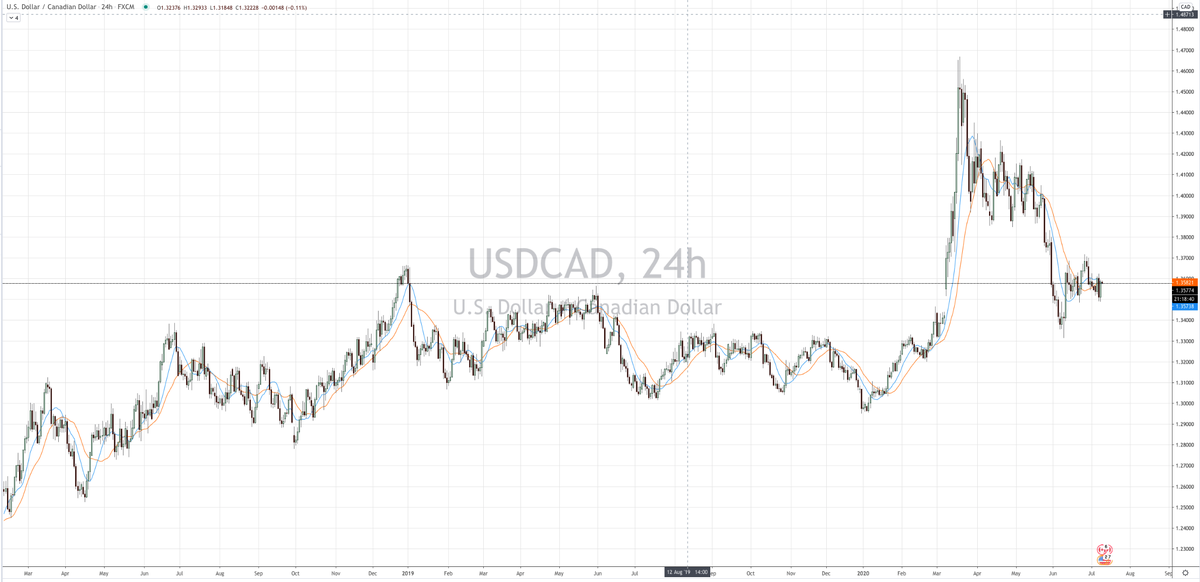
Look at $USDCAD with 10/20 SMA applied
notice the 10/20 x-over and over and over = mean reversion
notice that 10/20 point straight up and travel = trend
Look at $USDCAD with 10/20 SMA applied
notice the 10/20 x-over and over and over = mean reversion
notice that 10/20 point straight up and travel = trend
Or another way to see it is if 10/20 keep crossing over and over you are in a mean reversion regime and to fade rips and buy dips
If 10/20 are pointing in same direction its trending and need to buy dips and buy rips
If 10/20 are pointing in same direction its trending and need to buy dips and buy rips
The 10/20SMA tells you the regime and gives you some great characteristics of both market types
Notice the size of candles when 10/20 crosses over often - candles are tiny
When 10/20 point in the same direction and travel some distance, the candles are huge
Notice the size of candles when 10/20 crosses over often - candles are tiny
When 10/20 point in the same direction and travel some distance, the candles are huge
And if you know that about regimes, you don't need the 10/20SMA to tell you the regime
you can look at the chart and see small candle bodies with price going sideways = mean reversion
Large candle bodies with price going higher = trending
you can look at the chart and see small candle bodies with price going sideways = mean reversion
Large candle bodies with price going higher = trending
So when I see traders with charts covered in indicators it usually means that they don't undersand regimes and usually wouldn't understand that their stack of indicators are basically telling them the same thing just with different names and squiggly magic lines
Having a bunch of indicators often times means the trader is going to get a trade signal on all 5 indicators!!!
"oh wow all 5 of my indicators signal a selloff is coming, load the boat shoooort, I've never seen it so bearish!"
"oh wow all 5 of my indicators signal a selloff is coming, load the boat shoooort, I've never seen it so bearish!"
Yet it's really only 1 sell signal and usually in an extremely bullish regime
These traders are usually the hero top calling traders
If you are trying to figure this stuff out, join us at http://pollinatetrading.com and join the Trading Lab, we are going deep on this stuff. Do it!
These traders are usually the hero top calling traders
If you are trying to figure this stuff out, join us at http://pollinatetrading.com and join the Trading Lab, we are going deep on this stuff. Do it!
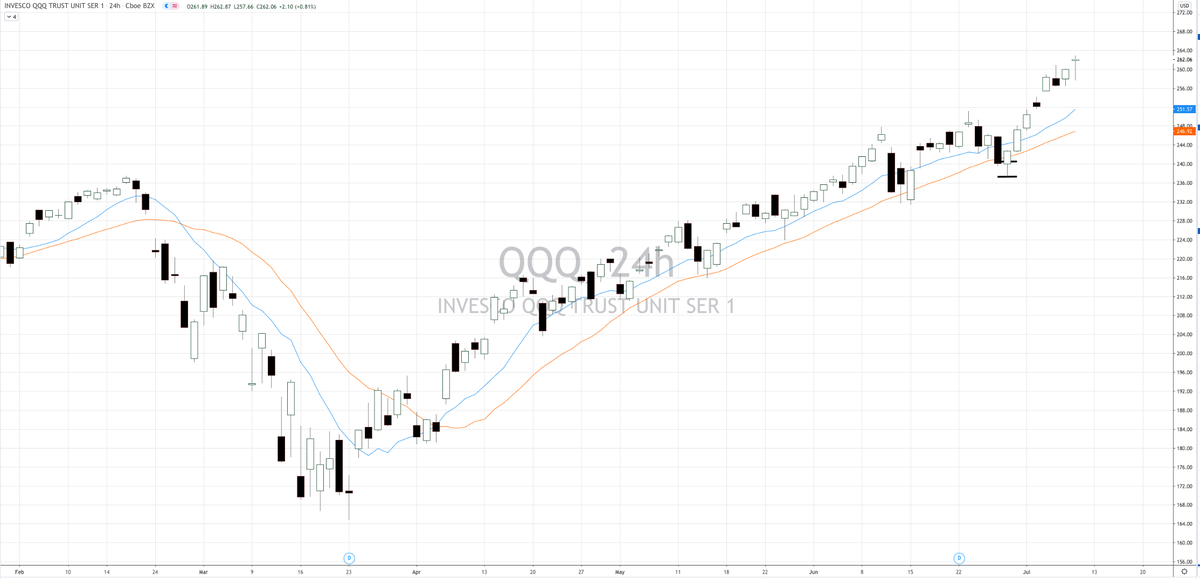
Ask yourself right now after everything you just read "does this look like a mean reverting setup?"
Or ask yourself, "is that a breakout that is trending and trending breakouts last longer and go further than everyone expects"
$QQQ
Or ask yourself, "is that a breakout that is trending and trending breakouts last longer and go further than everyone expects"
$QQQ

 Read on Twitter


