Some charts and thoughts on Energy dividends…Something strange - or at the very least instructive - is happening in the Energy Sector.
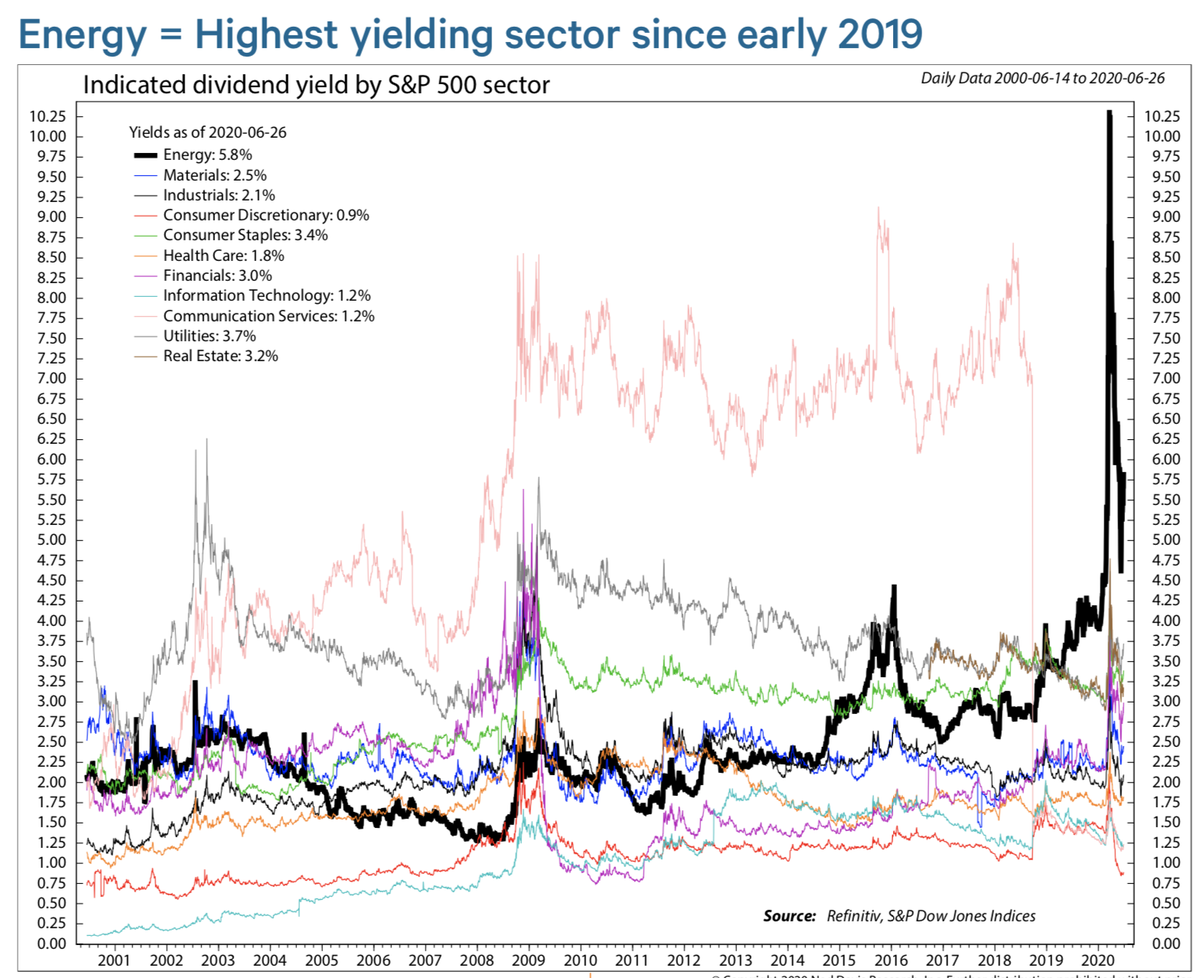
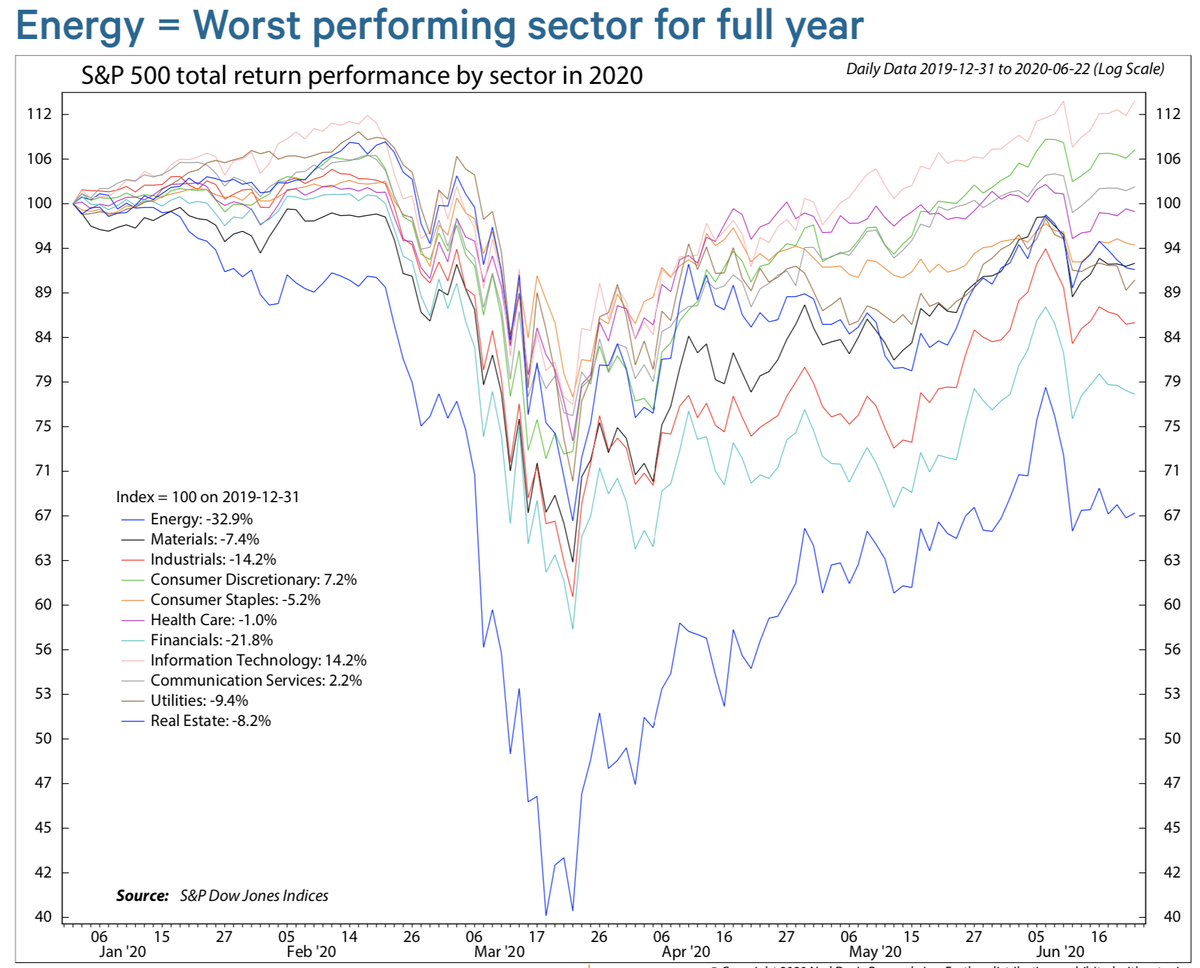
Beginning in April 2019, for the first time ever, Energy has been the highest yielding sector in the market. The coronavirus/carnage of 2020 has only exacerbated the divide. Energy’s indicated dividend yield is now >200 bp above next highest sector (Utilities).
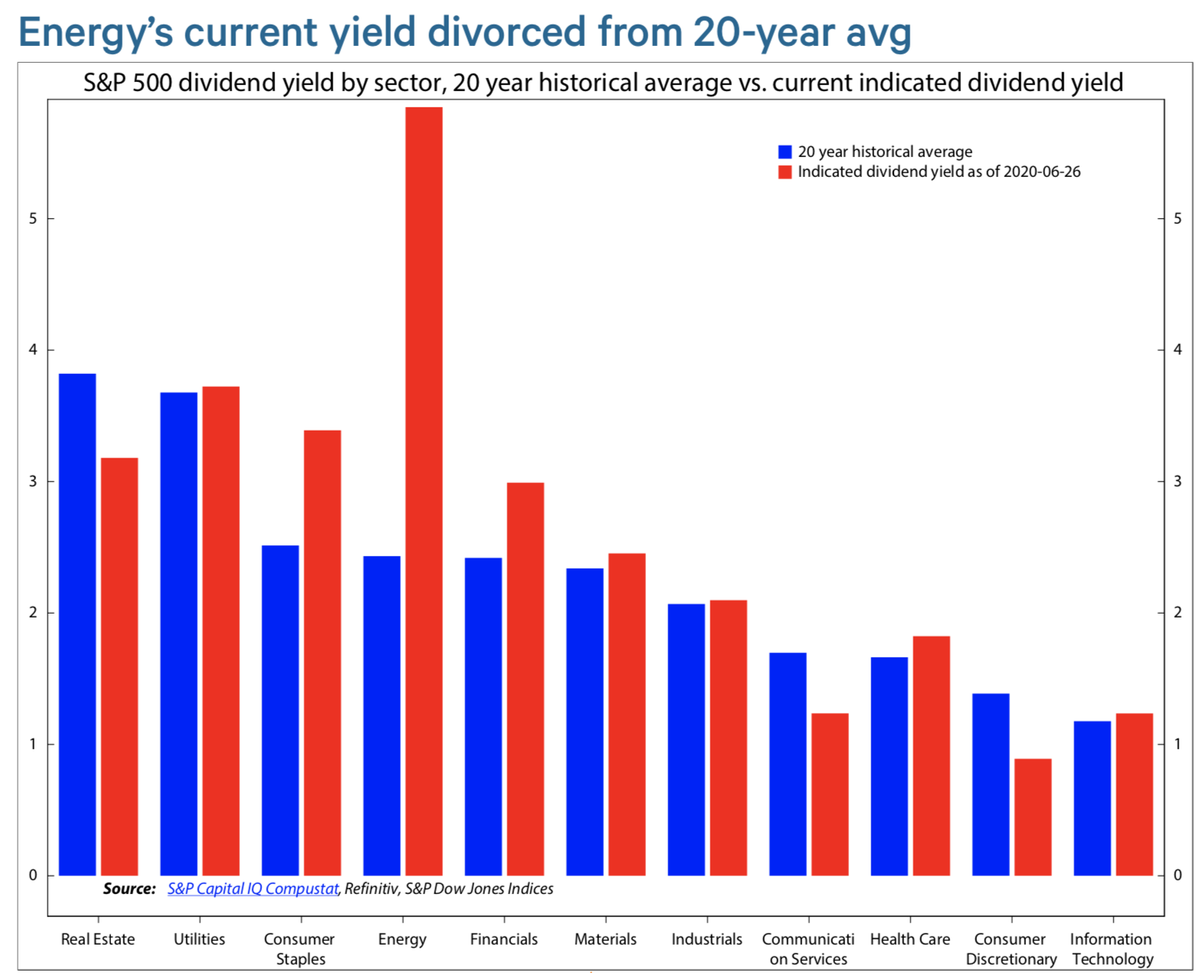
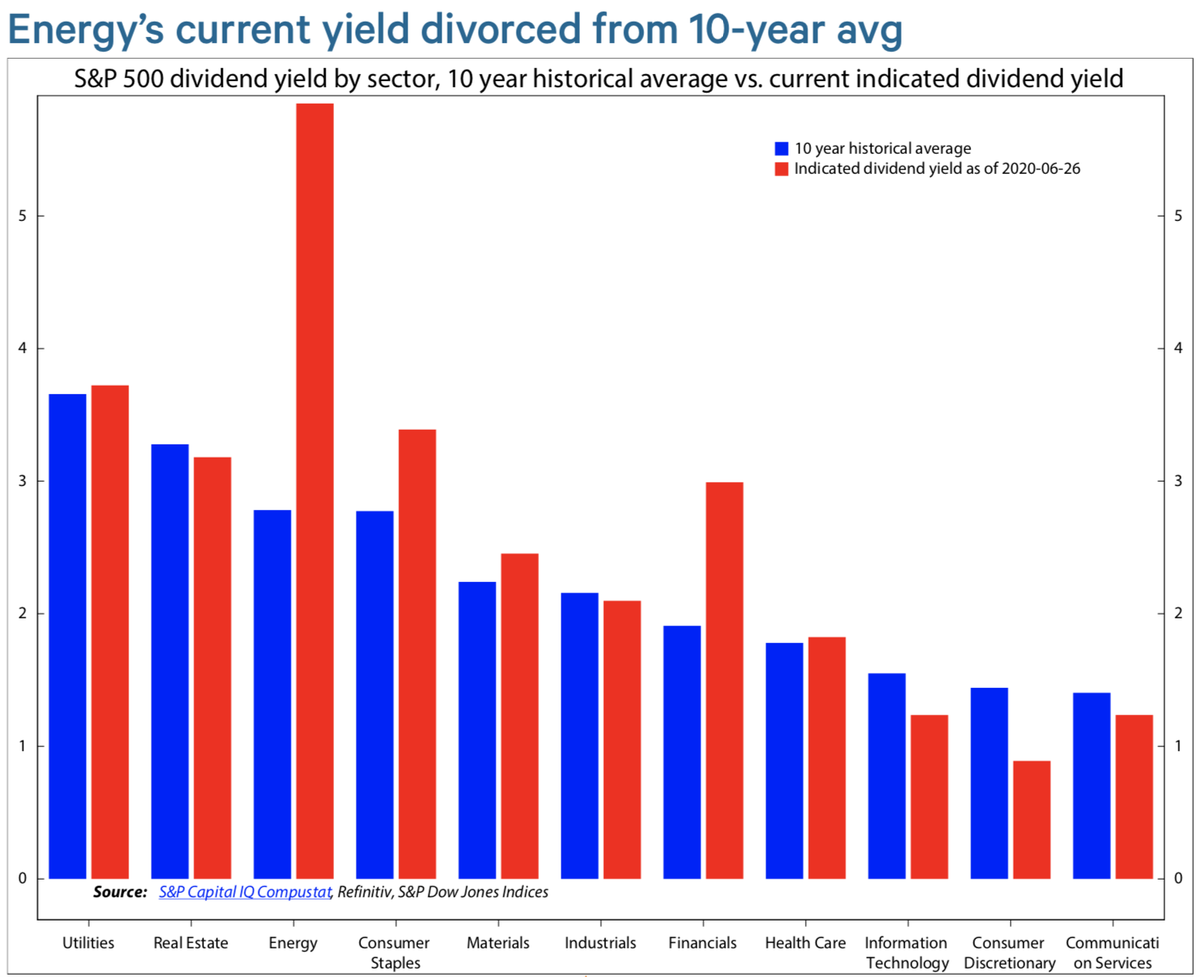
Energy div yields have divorced from their long-term averages as well (~300 bp above long-term div yield). On the other hand, all other sectors trade w/I +/- 60 bp of long-term average.
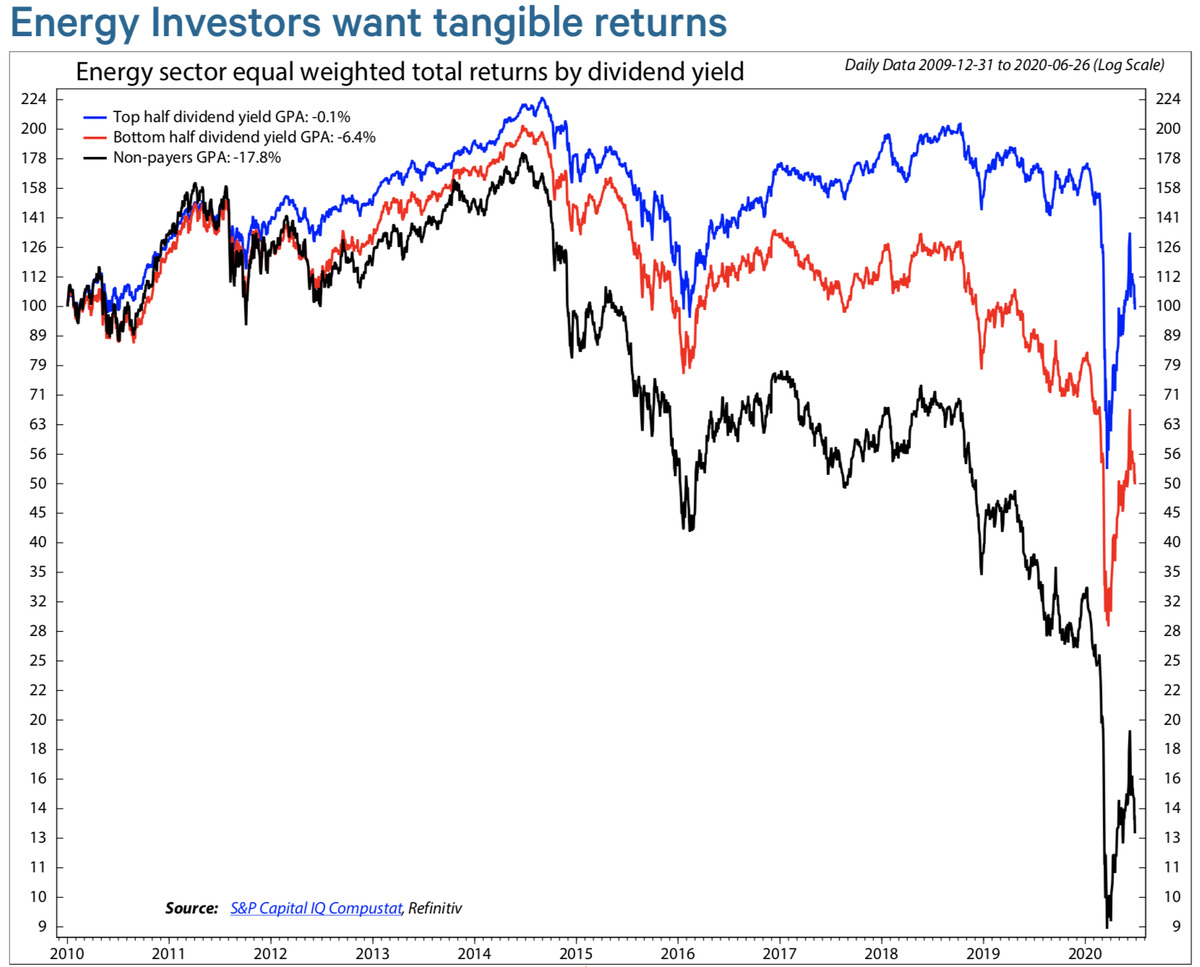
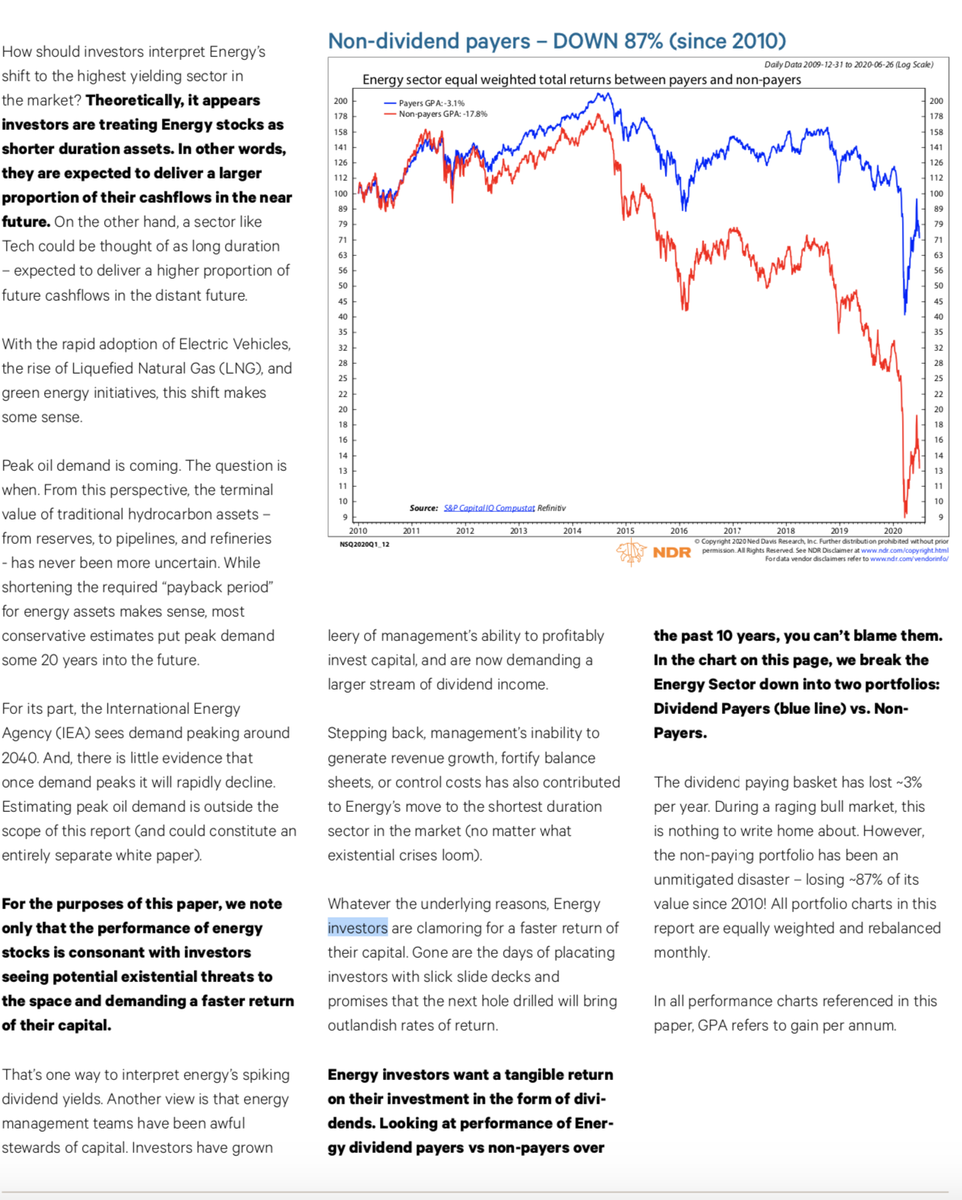
During the 2010s, only the highest yielding energy stocks have managed to preserve investor capital in the Energy Sector. A portfolio of non-dividend paying energy stocks is down ~87% since 2010.
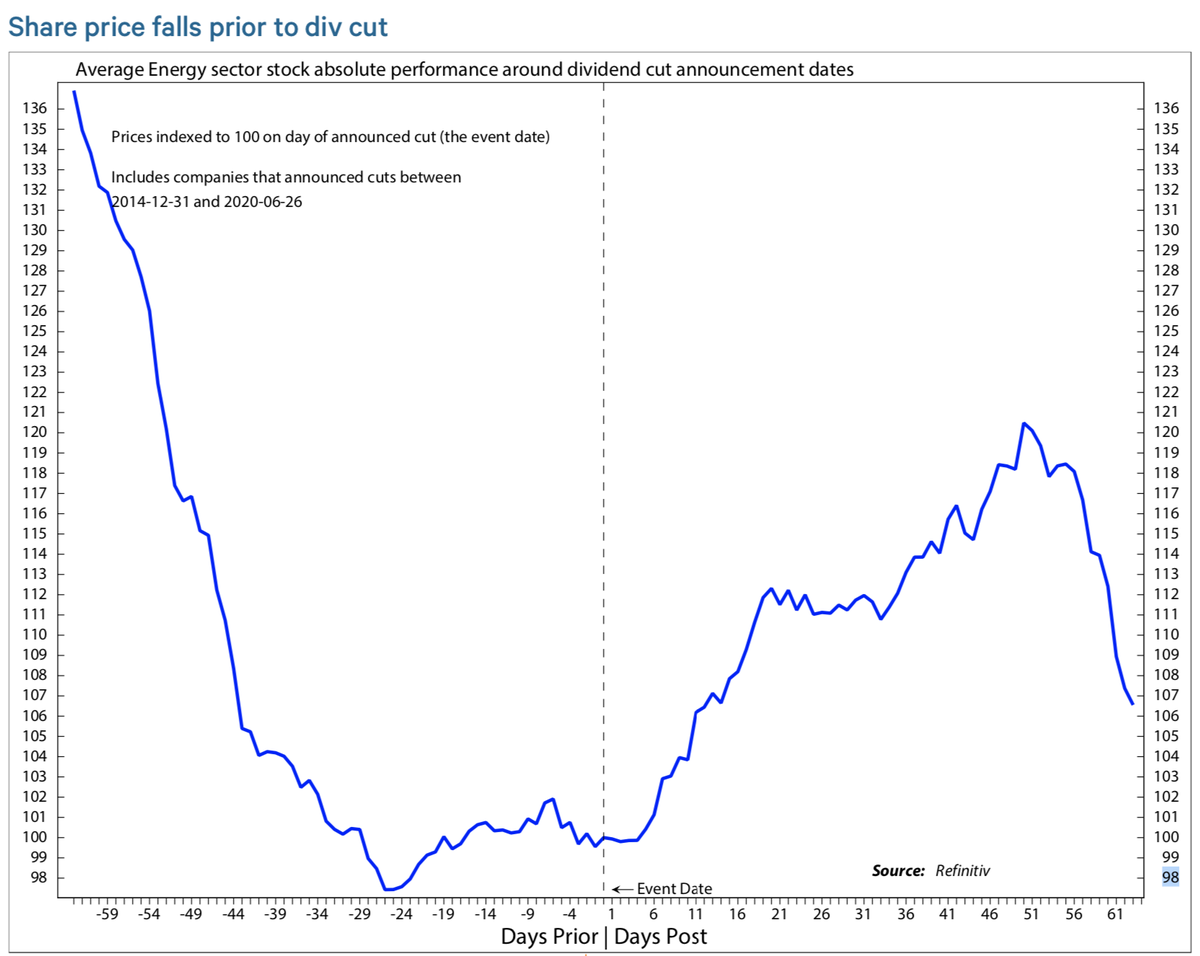
Unsurprisingly, dividend cutters are punished. Since 2014, dividend cutting energy stocks lose ~36%in the three months leading up to the announcement of a cut (i.e. market front runs the bad news).
The lesson/interpretation: Energy has become the “shortest duration” sector in the market. Put differently, investors have dramatically shortened the payback period on all traditional energy assets. (Excerpt from my 7/1 report).
There are good/structural reasons for this: Peak demand is in view, management has sucked at producing positive returns on investor capital, political risks are rising…All factors that make near-term cashflows critical to NPV.

 Read on Twitter