Frequent #COVID-19 question in US: why are cases increasing but deaths steady? Many explanations, for example @CT_Bergstrom. Simple model: take cases, smooth with Gaussian, lag deaths by some time after a confirmed case, multiply by case fatality rate. https://twitter.com/CT_Bergstrom/status/1277797018551717888
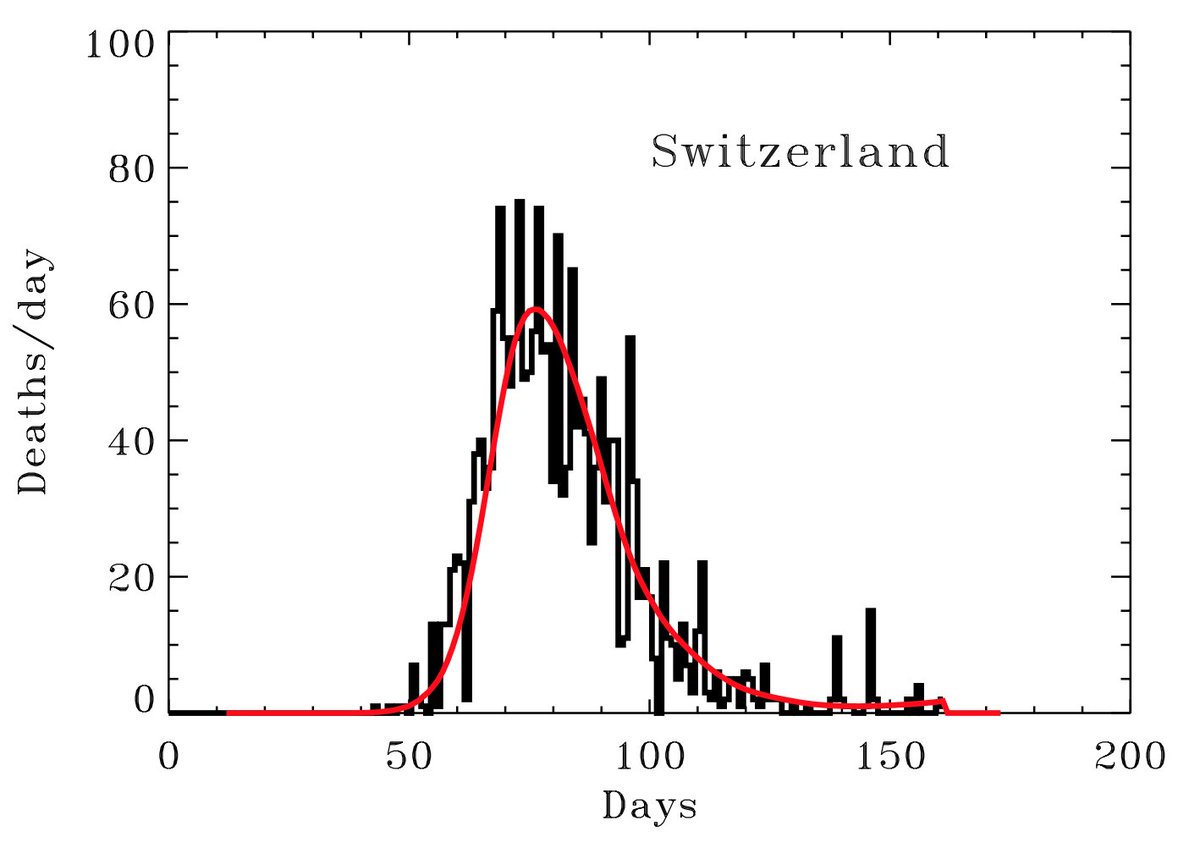
Given the simplicity, my eye is as good as MCMC. I took an initial guess, tweaked a bit, and reproduced the German death curve with: 12 day lag, spread over 12 days (FWHM), and fatality rate of 0.05. Looks good!
I used Germany because the testing has probably been consistent. Here are some other countries with likely consistent approaches. Some other countries have modest discrepancies, likely because of change in testing regime, but for simplicity sake, this works well.
To apply to the US, I wanted to know the cases going forward, which means fitting the cases/day into the future. I put a ceiling at 100,000 cases because that's a crazy number. This should be done at the state level, but not today.
Fit assumes constant case fatality ratio and does not work. The case fatality ratio decreases with time, not a surprise: testing much better, maybe different infection demographics. Missed deaths at first are because deaths didn't really lag cases in NYC -- testing was late.
I tweaked parameters, with case fatality rate of 7.5% at the beginning, dropping to 2% by mid-June (solid purple) or 1.3% by today and staying flat. The two curves both explain the drop and predict an increase, one soon and one delayed.
This simplistic approach demonstrates (a) the "constant" death rate today consistent with the increasing cases, (b) deaths are delayed but coming, and (c) testing is much better. Benefits of simplicity: easily generalizable. Drawback: a bit silly. Should apply to state data.
Oh, and all data from the Johns Hopkins website @JHUSystems CSSE, many thanks to them for making data so easily accessible! https://github.com/CSSEGISandData/COVID-19/

 Read on Twitter


