A thread on NBA home court advantage, using play by play data going back to 1996.
Home court advantage by minute, as measured by difference in points per possession (ppp).
1/
Home court advantage by minute, as measured by difference in points per possession (ppp).
1/
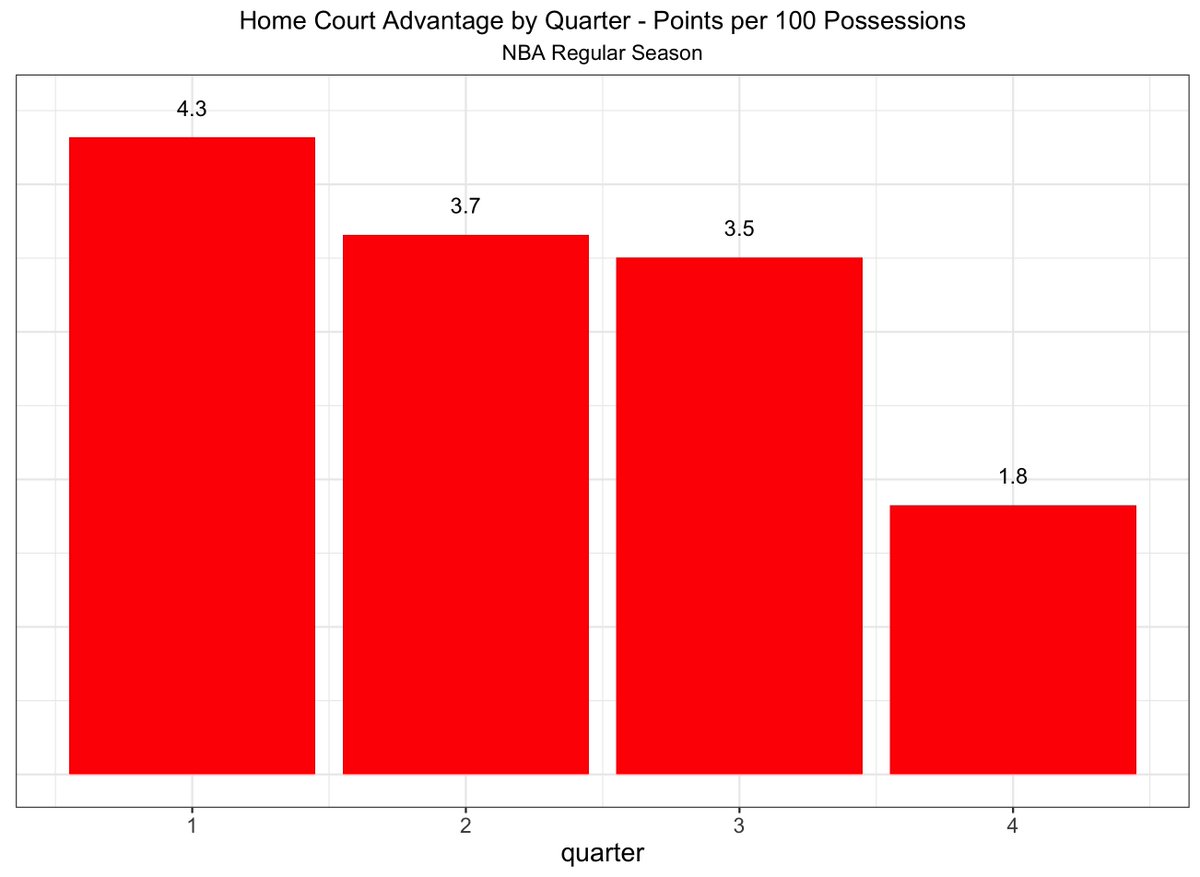
Aggregated by quarter.
So, does home court advantage "wear off" as the game goes on? Or is this a sampling bias issue due to home teams being ahead later in the game?
2/
So, does home court advantage "wear off" as the game goes on? Or is this a sampling bias issue due to home teams being ahead later in the game?
2/
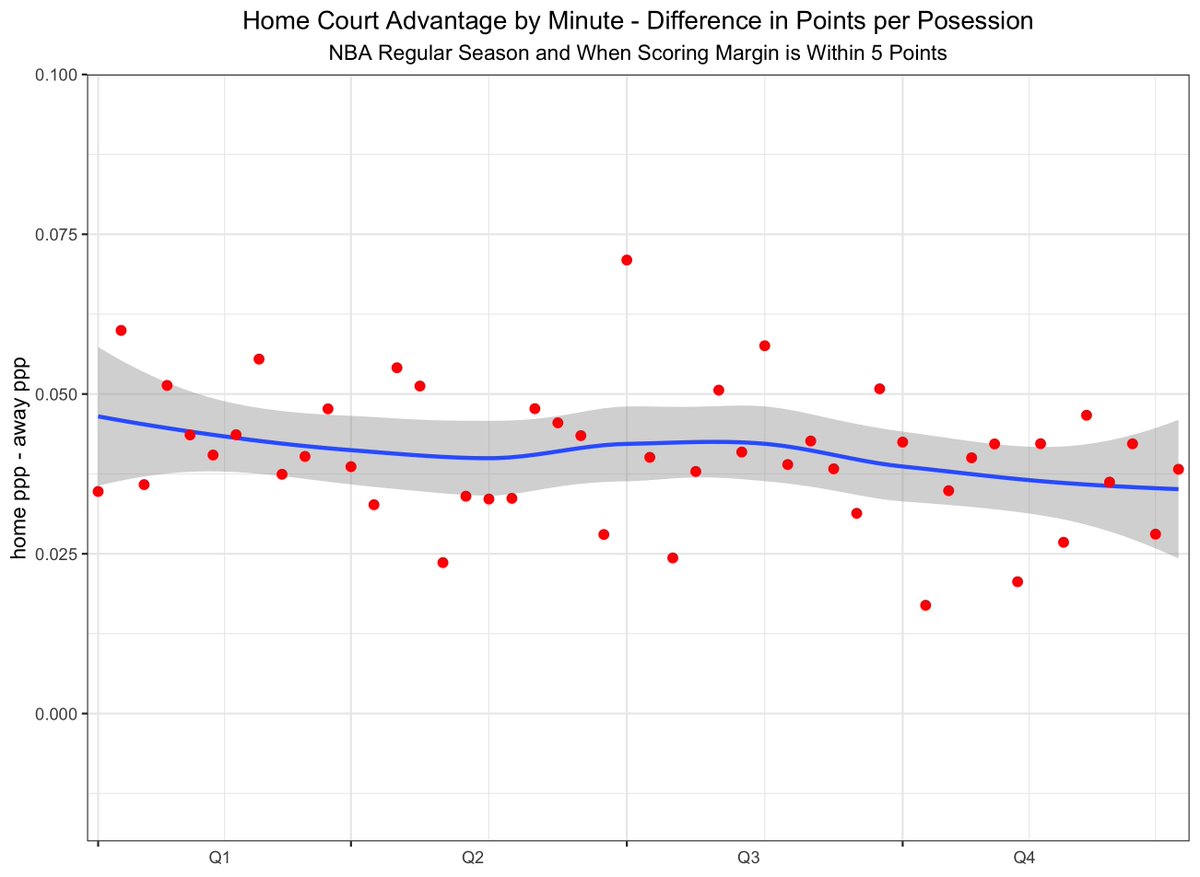
If we restrict to situations in which the score is within five points. By minute and quarter:
You see less of a drop off, indicating home court advantage is more consistent across the game as long as the game remains competitive.
3/
You see less of a drop off, indicating home court advantage is more consistent across the game as long as the game remains competitive.
3/
Another way of controlling for game context and "garbage time" skewing the results is to look at win probability added for home teams.
Using win probability added, we see no drop off in home court advantage as the game progresses:
4/
Using win probability added, we see no drop off in home court advantage as the game progresses:
4/
You can also use win probability added to determine what actually drives home court advantage, by breaking it down by the four factors.
This sums exactly to the win percent above 0.500 for home teams since 1996 (59%).
5/
This sums exactly to the win percent above 0.500 for home teams since 1996 (59%).
5/
The most important factor driving hca is shooting. Home teams shoot more efficiently. What surprised me:
1. Rebounding was the second most important factor
2. Free throws were the least important factor
6/
1. Rebounding was the second most important factor
2. Free throws were the least important factor
6/
Here is the previous win probability chart broken out by season. Some variation year to year, but FG shooting consistently the most important factor driving hca:
7/
7/
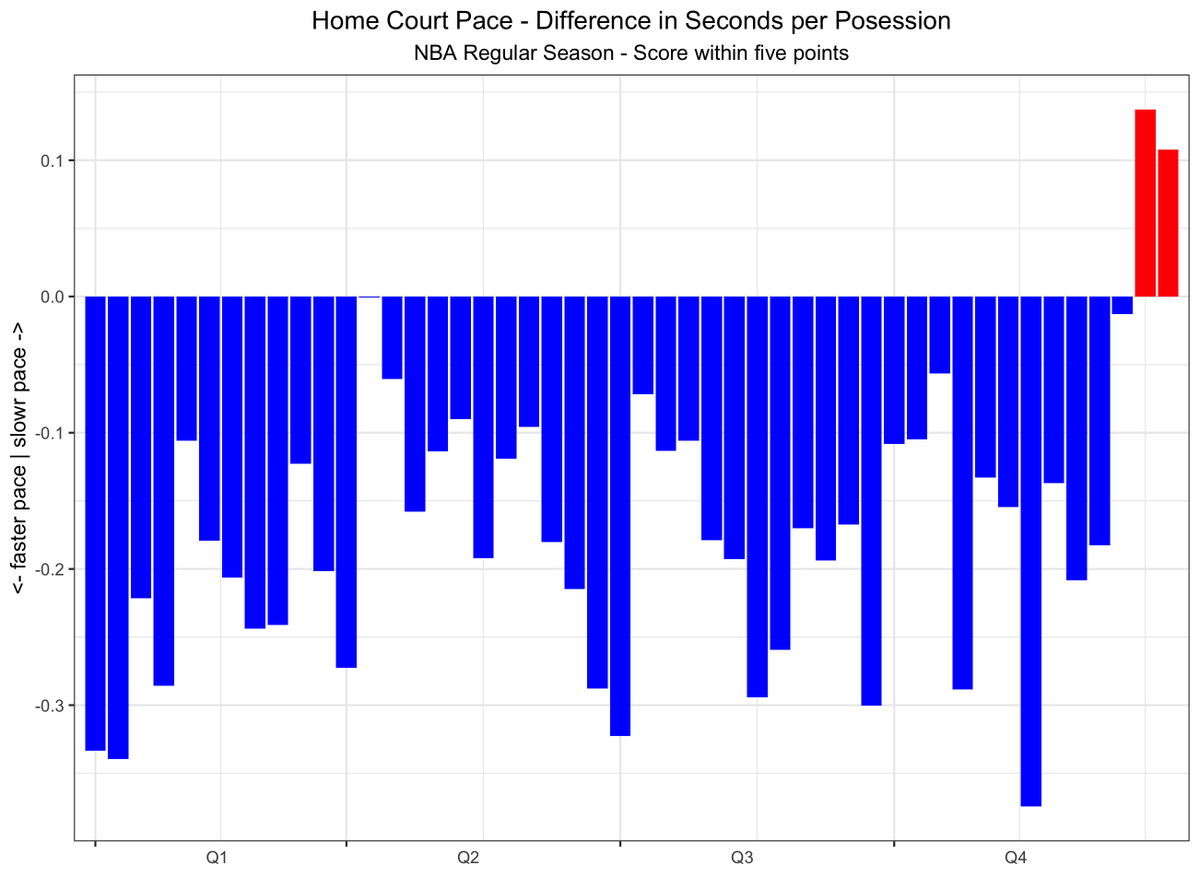
And here is how home court affects offensive pace. Home teams play at a faster pace, until the final minutes.
Lots of sampling bias here. Possessions starting from a turnover or def rebound are quicker, and home teams force more missed shots and turnovers.
8/
Lots of sampling bias here. Possessions starting from a turnover or def rebound are quicker, and home teams force more missed shots and turnovers.
8/

 Read on Twitter


