Turnout in Russia's referendum by noon (local time):
National average: 58.3%
Chechnya: 88.7%
http://www.vybory.izbirkom.ru/region/region/izbirkom?action=show&root=1&tvd=100100163596969&vrn=100100163596966®ion=0&global=1&sub_region=0&prver=0&pronetvd=null&vibid=100100163596969&type=450
National average: 58.3%
Chechnya: 88.7%
http://www.vybory.izbirkom.ru/region/region/izbirkom?action=show&root=1&tvd=100100163596969&vrn=100100163596966®ion=0&global=1&sub_region=0&prver=0&pronetvd=null&vibid=100100163596969&type=450
Regions where 85+% voted for Putin on 85+% turnout in 2018 and their turnout figures at noon today:
Dagestan: 78.4%
Kabardino-Balkaria: 74.0%
Karachay-Cherkessia: 79.9%
Tuva: 86.3%
Chechnya: 88.%
Yamalo-Nenets: 73.9%
(national average: 58.3%)
The people there must love voting.
Dagestan: 78.4%
Kabardino-Balkaria: 74.0%
Karachay-Cherkessia: 79.9%
Tuva: 86.3%
Chechnya: 88.%
Yamalo-Nenets: 73.9%
(national average: 58.3%)
The people there must love voting.
I wonder how this is going to affect the generally low turnout (and weakly pro-Putin) results in Moscow. https://meduza.io/en/news/2020/06/30/online-voting-in-russia-s-constitutional-plebiscite-closes-with-93-percent-turnout
About a third of the Tuva votes are in. 97.2% "voted" yes. Chechnya is going to have to up its game.
Here's one obvious sign of electoral fraud. 89.84% of the voters in one of Russia's regions (Yamalo-Nenets) "voted" for the new constitution. That in itself is suspicious. But look at the breakdown by city. Virtually, all the results are within 1% of that average.
To give you a sense why the above is problematic, look at the 2016 presidential results in New York (by county). Clinton got 59% of the statewide vote, but there's huge variation by county (I didn't include all the counties). Basic laws of statistics tell us to expect variation.
Another fascinating feature of Russia's vote reporting is the preliminary tally. Note how it was 76.22% (a few minutes ago) with roughly half the votes counted. Last update before that it was 75%. The one before that, it was 72%. Now, it's suddenly 77.88%.
If this happened in one election, you could explain it away. But this is a feature of every Russian election I've paid attention to. The last votes are always overwhelmingly for Putin. The only plausible explanation is last second ballot stuffing to meet a "required" result.
Also, note the stories from earlier today showing No in the lead after some ballots were counted. In the US, early numbers are meaningless because results vary tremendously by county. But in Russia, results are virtually the same everywhere. Where did those numbers come from?
Worry not Chechnya fans. Through sheer willpower and love of Putin, Chechnya surpassed Tuva's share of Yes votes. Better luck next time.
Here's another way to catch electoral fraud. The percentage of invalid ballots should be unrelated to either turnout or particularly the government's share of the vote. In other words, most regions should have a similar percentage of invalid votes, regardless of how they voted.
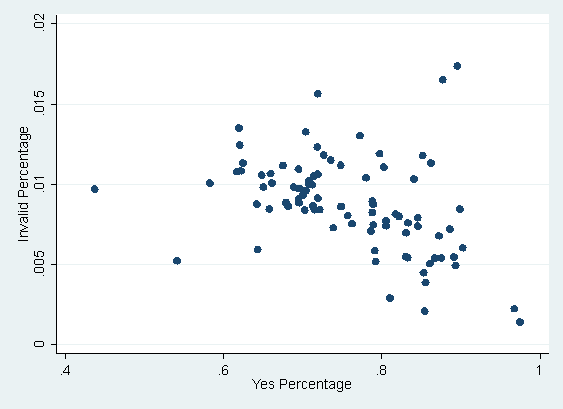
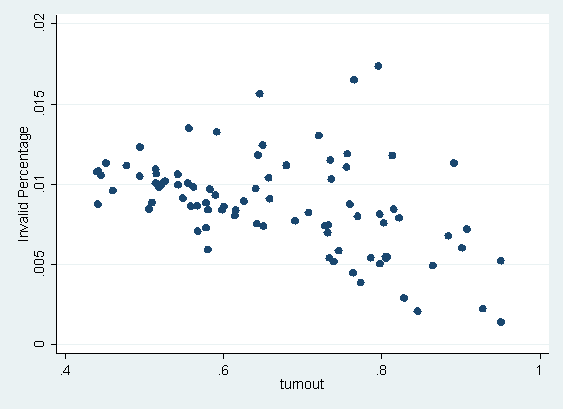
You'll be surprised to know that this wasn't the case in Russia. The share of invalid votes is negatively correlated with both turnout and Yes vote. Meaning that in regions with a higher turnout and/or high Yes vote, the number of invalid votes was much lower.
In regions where 85+% voted Yes, 0.7% of the votes were invalid.
In regions where 75-85% voted Yes, 0.8% were invalid.
In regions where <75% voted Yes, 1.0% were invalid.
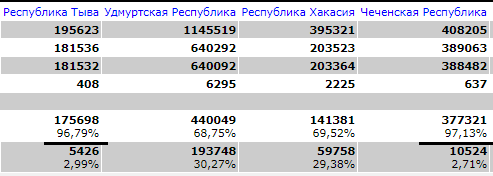
E.g., in Chechnya (97% Yes), 0.1% were invalid. In the 5 least supportive regions, 1.1% were invalid.
In regions where 75-85% voted Yes, 0.8% were invalid.
In regions where <75% voted Yes, 1.0% were invalid.
E.g., in Chechnya (97% Yes), 0.1% were invalid. In the 5 least supportive regions, 1.1% were invalid.
Here's the invalid share of the vote plotted against the Yes vote and turnout. Textbook negative correlations.
I could think of 2 reasons for the low number of invalid votes in the Yes regions. One is that invalid votes are simply placed in the Yes column in those regions. The more damning possibility is that if a region has 1/5 of the invalid votes, only 1/5 of its other votes are real.
If we assume the latter (a region with 1/5 the expected invalid votes had 4/5 of its "votes" created through ballot-stuffing), then we can simply subtract those extra votes from each region with few invalid votes. Result? 10 million fewer votes. https://twitter.com/jakluge/status/1278584014585188352
In regions where the % of invalid votes was below average, Yes got 80.0% of the vote.
In regions where the % of invalid votes was average/above average, Yes got 71.8% of the vote.
The latter also happens to be more consistent with the initial results.
In regions where the % of invalid votes was average/above average, Yes got 71.8% of the vote.
The latter also happens to be more consistent with the initial results.

 Read on Twitter


