So glad to see @TorontoStar's in-depth analysis about the COVID situation in Toronto's northwest. This corner of the city needs our attention in a big way. Thanks @jyangstar @katecallen @rachelmendleson @primarydata https://www.thestar.com/news/gta/2020/06/28/torontos-covid-19-divide-the-citys-northwest-corner-has-been-failed-by-the-system.html 1/
The conclusions are quite consistent with analyses I did which informed the latest issue of @thelocalhealth. Here's a data dump of my analyses. Draw your own conclusions. 2/
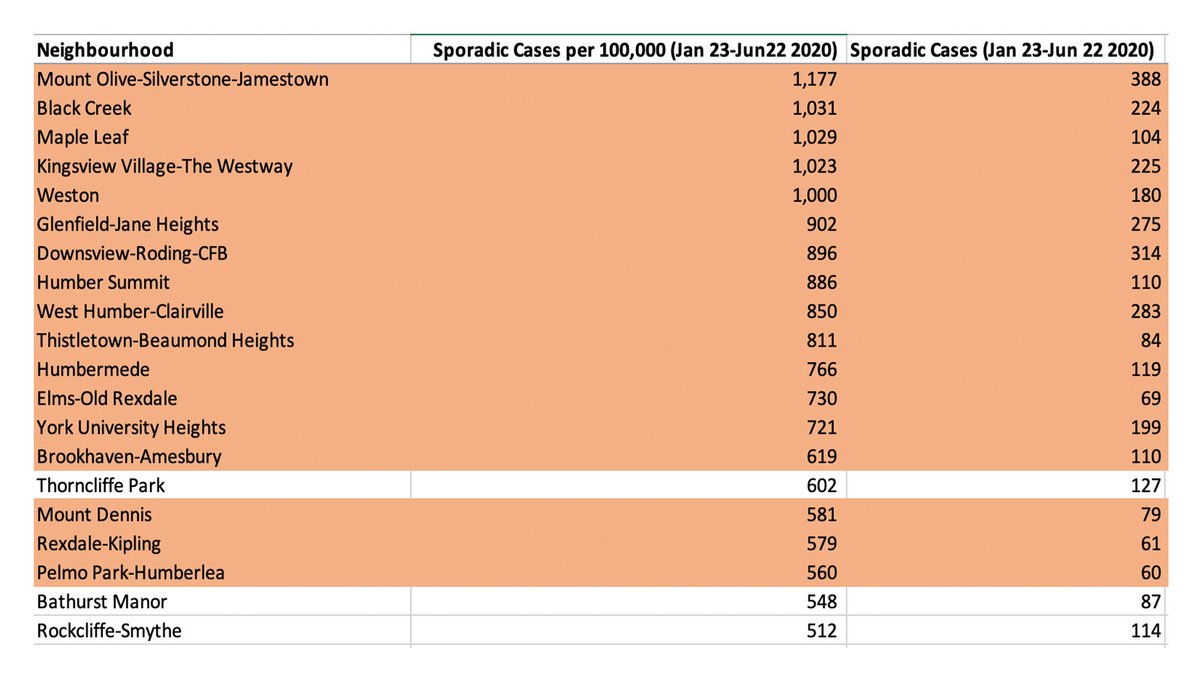
There are 23 neighbourhoods in Toronto's northwest, which I define as anything north of Eglinton Ave and west of Dufferin St. Of the top 20 neighbourhoods in Toronto for rates of sporadic COVID-19 cases (not counting institutional outbreaks), 17 are in the northwest (orange). 3/
There is some relationship between the ethnic concentration of a neighbourhood and rates of COVID. Pay attention to R-squared = 0.2342. Northwest neighbourhoods in orange. 4/
Association is stronger between Black population concentration and rates of COVID is strong. R-squared = 0.4069. No other racial/ethnic grouping shows a stronger relationship. 5/
Low-income measure (after tax) doesn't show a strong relationship, certainly now as much as I was expecting to see. 6/
Material deprivation in a neighbourhood offers one of the best explanations for the rates of COVID cases we're seeing across the city. R-squared = 0.4469. M/D takes into account income, high school grad., housing quality, etc & is a good class indicator IMO. 7/
Aside: Relationship between race and class is very strong. Some call this "intersectionality," which we know plays a big role in creating socio-spacial segregation in many North American cities, and we definitely see that in the northwest. 8/
Large family size does play a role. Here is relationship between neighbourhoods with high % of people in households of 5+ ppl and COVID cases. Effects seem more pronounced in the northwest. 9/
Let's look at work. Neighbourhoods w/ high % of ppl working in transportation & warehousing have high rates of COVID, esp in the northwest. Remember, these were deemed essential work since the beginning of the pandemic. R-squared = 0.4471, highest among all factors analyzed. 10/
Retail work doesn't show a strong relationship with COVID rates at neighbourhood level. Maybe retail workers are better protected in the work environment than warehouse workers? 11/

 Read on Twitter


