Dear Friends,
If your are breakout trader, this scanner is for you..
Donchian Channel indicator helps out to filter out the break out stocks.
If your are breakout trader, this scanner is for you..
Donchian Channel indicator helps out to filter out the break out stocks.
Donchian Channel: Thread
- It is developed by Richard Donchian
Donchian Channel consists 3 bands
1. Upper band
2. Middle band
3. Lower band
The area between the upper and lower bands represents the Donchian Channel.
- He would later be nicknamed "The Father of Trend Following
- It is developed by Richard Donchian
Donchian Channel consists 3 bands
1. Upper band
2. Middle band
3. Lower band
The area between the upper and lower bands represents the Donchian Channel.
- He would later be nicknamed "The Father of Trend Following
Calculation
1. Upper band
Highest High in Last N Periods. Default period is 20. This means get the highest price in last 20 candles.
2. Lower band
Lowest low in Last N Periods. Default period is 20. This means get the lowest price in last 20 candles.
1. Upper band
Highest High in Last N Periods. Default period is 20. This means get the highest price in last 20 candles.
2. Lower band
Lowest low in Last N Periods. Default period is 20. This means get the lowest price in last 20 candles.
3. Middle band
(Highest High + Lowest low )/2
Eg: In last 20 days
highest price is 400
lowest price is 300
then
Upper band is 400
lower band is 300
middle band is 350
(Highest High + Lowest low )/2
Eg: In last 20 days
highest price is 400
lowest price is 300
then
Upper band is 400
lower band is 300
middle band is 350
How to know what is the breakout?
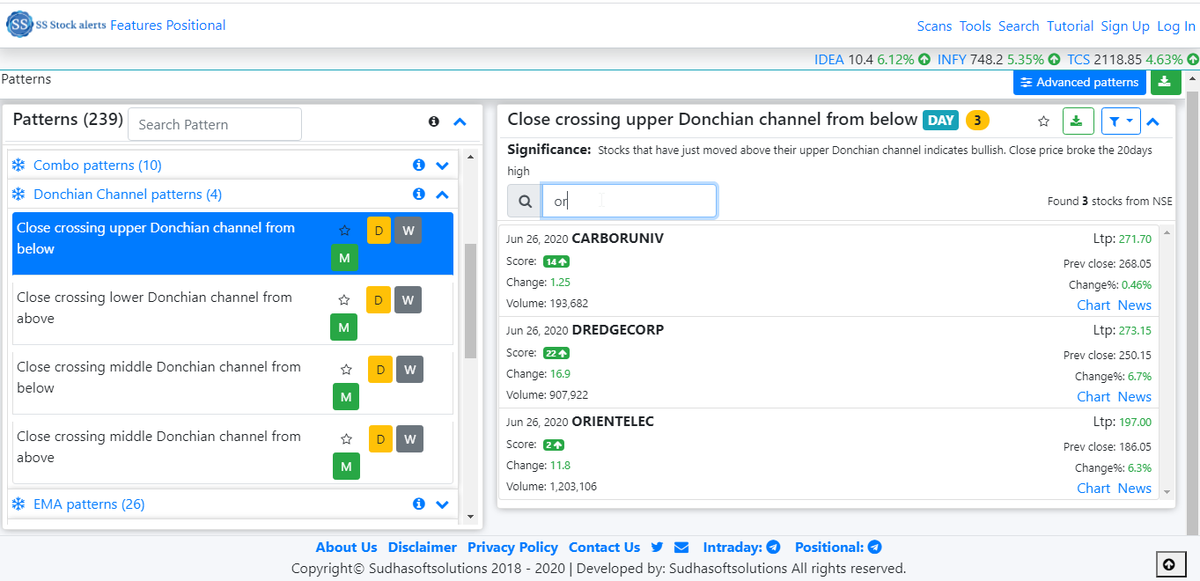
When ever stock is closed above the Donchian channel upper band, it means price is broken 20 days high price and it indicates bullish.
how to find it?
It is easy using the scanner
Close crossing upper Donchian channel from below
When ever stock is closed above the Donchian channel upper band, it means price is broken 20 days high price and it indicates bullish.
how to find it?
It is easy using the scanner
Close crossing upper Donchian channel from below
How to know what is the breakdown?
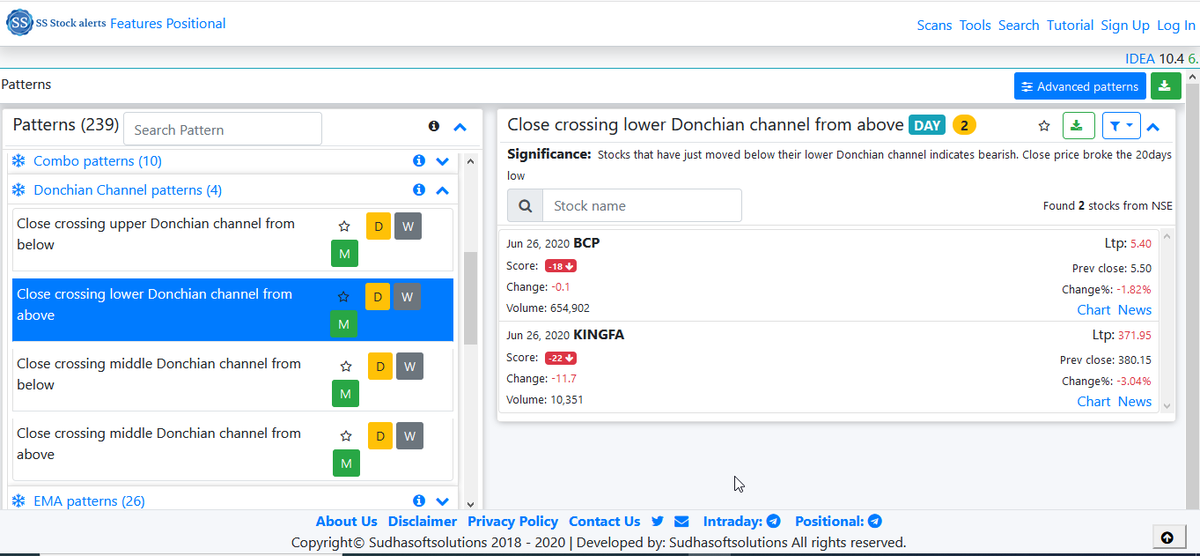
When ever stock is closed below the Donchian channel lower band, it means price is broken 20 days low price and it indicates bearish.
how to find it?
It is easy using the scanner
Close crossing lower Donchian channel from above
When ever stock is closed below the Donchian channel lower band, it means price is broken 20 days low price and it indicates bearish.
how to find it?
It is easy using the scanner
Close crossing lower Donchian channel from above
How to run your profits?
Once take a trade, then ride your winner as given below
- Use middle band as dynamic trailing stoploss, when ever price closed below middle band, exit your trade.
- When ever price is closed above middle band, it indicates it is bullish.
Once take a trade, then ride your winner as given below
- Use middle band as dynamic trailing stoploss, when ever price closed below middle band, exit your trade.
- When ever price is closed above middle band, it indicates it is bullish.

 Read on Twitter


