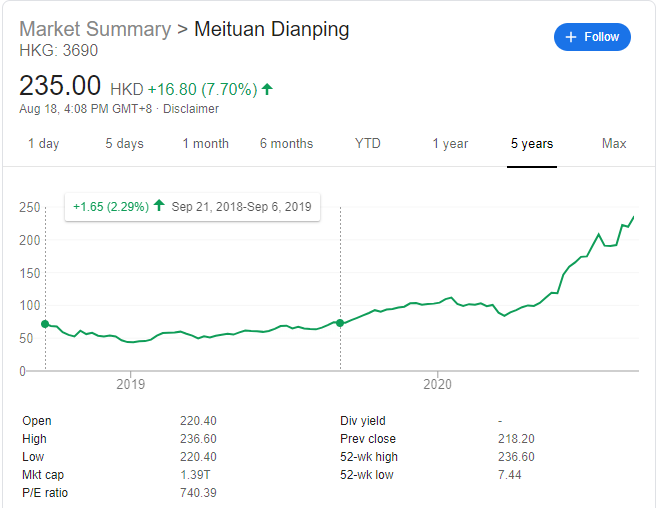
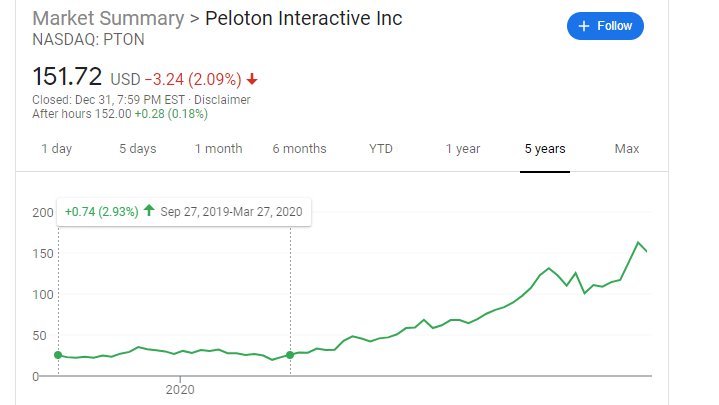
Not many VC types look at/ believe in technicals, not many chart types deep dive into SaaS, but I’ve noticed many successful SaaS companies are flat for 12-18 months and suddenly expand multiples after that
Causations asides, many follow this pattern of either 1) public misunderstanding of business model/potential, 2) over-priced IPO, 3) hit business inflection point 12-18 months into IPO
Coincidence? What else could it be?
Coincidence? What else could it be?
Eg. $TWLO $PTON $MTCH $ESTC $RNG
These examples had different enough IPO timing so it’s likely not just beta
These examples had different enough IPO timing so it’s likely not just beta
IF this hypothesis is true, maybe it’s not important to draw conclusions right out of the gates from S-1, but rather, follow closely how management is going to evolve the team, product, strategy, after they go public
$FB to me is the ultimate example of this:
their inflection point was when they proved that they could monetize mobile - price shot up after earnings in 2013 to the $30s, but risk was significantly reduced
their inflection point was when they proved that they could monetize mobile - price shot up after earnings in 2013 to the $30s, but risk was significantly reduced
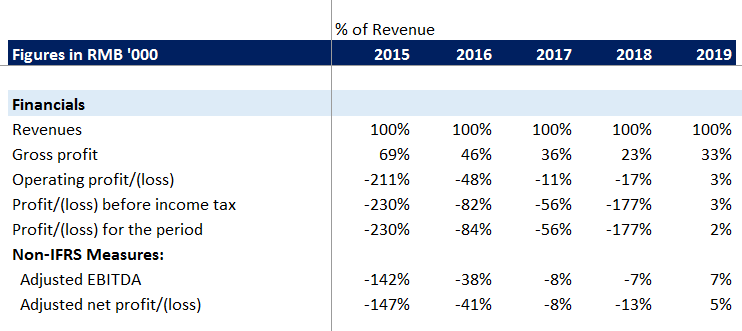
http://3690.HK Meituan is another one:
- monster inflection point mid 2019 to break even
- risk in 2019 was way lower than 2018 because it was still hard to see how competition with http://ele.me/Alibaba would shake out at the time
- monster inflection point mid 2019 to break even
- risk in 2019 was way lower than 2018 because it was still hard to see how competition with http://ele.me/Alibaba would shake out at the time
great thread related to this https://twitter.com/plaffont/status/1345795314071040001?s=20

 Read on Twitter


