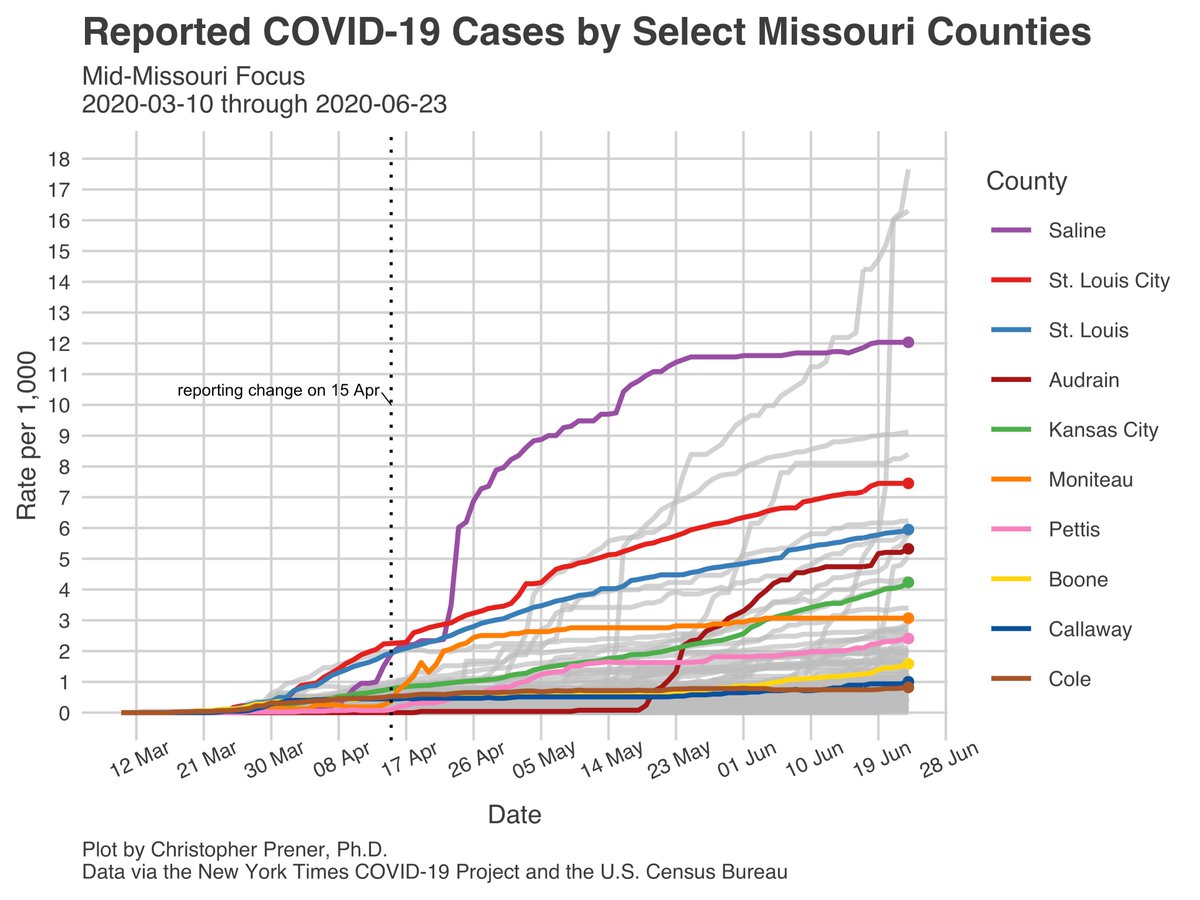
Short #Missouri #COVID19 evening update  for Wednesday, 6/24. I’ve pushed updates to all metrics to the website - https://slu-opengis.github.io/covid_daily_viz/.
The statewide 7-day average of new cases and the “outstate” trend both hit new peak numbers. This is also with 87 “missing” cases… 1/15
 for Wednesday, 6/24. I’ve pushed updates to all metrics to the website - https://slu-opengis.github.io/covid_daily_viz/.
The statewide 7-day average of new cases and the “outstate” trend both hit new peak numbers. This is also with 87 “missing” cases… 1/15
…in McDonald County. There are always small discrepancies between @nytimes, the state's and local sources. But given that McDonald is a big part of our spike in new cases, this is particularly frustrating. I don’t feel conspiratorial about this, but its a significant gap... 2/15
...worth digging into.
As of yesterday, McDonald County reported approximate 490 cases. However, I only show 403 cases. I’m basing this on reporting from the @JoplinGlobe. 3/15 https://www.joplinglobe.com/coronavirus/more-than-100-new-covid-19-cases-reported-in-jasper-county/article_c28101fa-b5b9-11ea-90c2-bb7435d7797a.html
As of yesterday, McDonald County reported approximate 490 cases. However, I only show 403 cases. I’m basing this on reporting from the @JoplinGlobe. 3/15 https://www.joplinglobe.com/coronavirus/more-than-100-new-covid-19-cases-reported-in-jasper-county/article_c28101fa-b5b9-11ea-90c2-bb7435d7797a.html
Moreover, as with yesterday, the statewide increase does not include the 291 new cases today added in MO. Keep both lagging data points in mind.
Our testing environment is different in June than April or May, and so comparing this to past peaks is not straight forward. 4/15
Our testing environment is different in June than April or May, and so comparing this to past peaks is not straight forward. 4/15
Outstate continues to make up about 54% of the 7-day average’s new cases, a larger share than it has ever made up before. As with the last ten days or so, the area of greatest concern is in the southwest part of the state. 5/15
McDonald, Jasper, and Newton counties now make up 3 of the top 11 counties in MO in terms of new cases  (with the 87 cases that are “missing”, McDonald would be no. 7 in the state when #KansasCity is treated as a county). 6/15
 (with the 87 cases that are “missing”, McDonald would be no. 7 in the state when #KansasCity is treated as a county). 6/15
Another area seeing notable numbers of new cases are St. Francois and Perry counties. Many of these cases in St. Francois County are from Bonne Terre prison, but I’m not sure they make up all of them... 7/15
My skepticism  is based on comparing reporting @ChrisHayesTV at @FOX2now, who reported 36 cases in the prison as of Monday. In June, St. Francois has added 49 cases. So, I’m skeptical that there are no other sources of COVID there right now. 8/15 https://fox2now.com/news/fox-files/mass-prison-testing-reveals-covid-19-spike/
 is based on comparing reporting @ChrisHayesTV at @FOX2now, who reported 36 cases in the prison as of Monday. In June, St. Francois has added 49 cases. So, I’m skeptical that there are no other sources of COVID there right now. 8/15 https://fox2now.com/news/fox-files/mass-prison-testing-reveals-covid-19-spike/
Another change of note is visible at the metro level, where the Columbia metro now has its highest 7-day average of new cases of the pandemic. We’re also seeing cases tick upward in the Springfield and Jeff City metros as well. 9/15
The trend in Columbia  seems to be driven by the slow but steady growth of COVID in Boone County as well as small numbers of new cases in Audrain County that accompany upticks elsewhere in Mid Missouri
  . 10/15
 seems to be driven by the slow but steady growth of COVID in Boone County as well as small numbers of new cases in Audrain County that accompany upticks elsewhere in Mid Missouri
  . 10/15
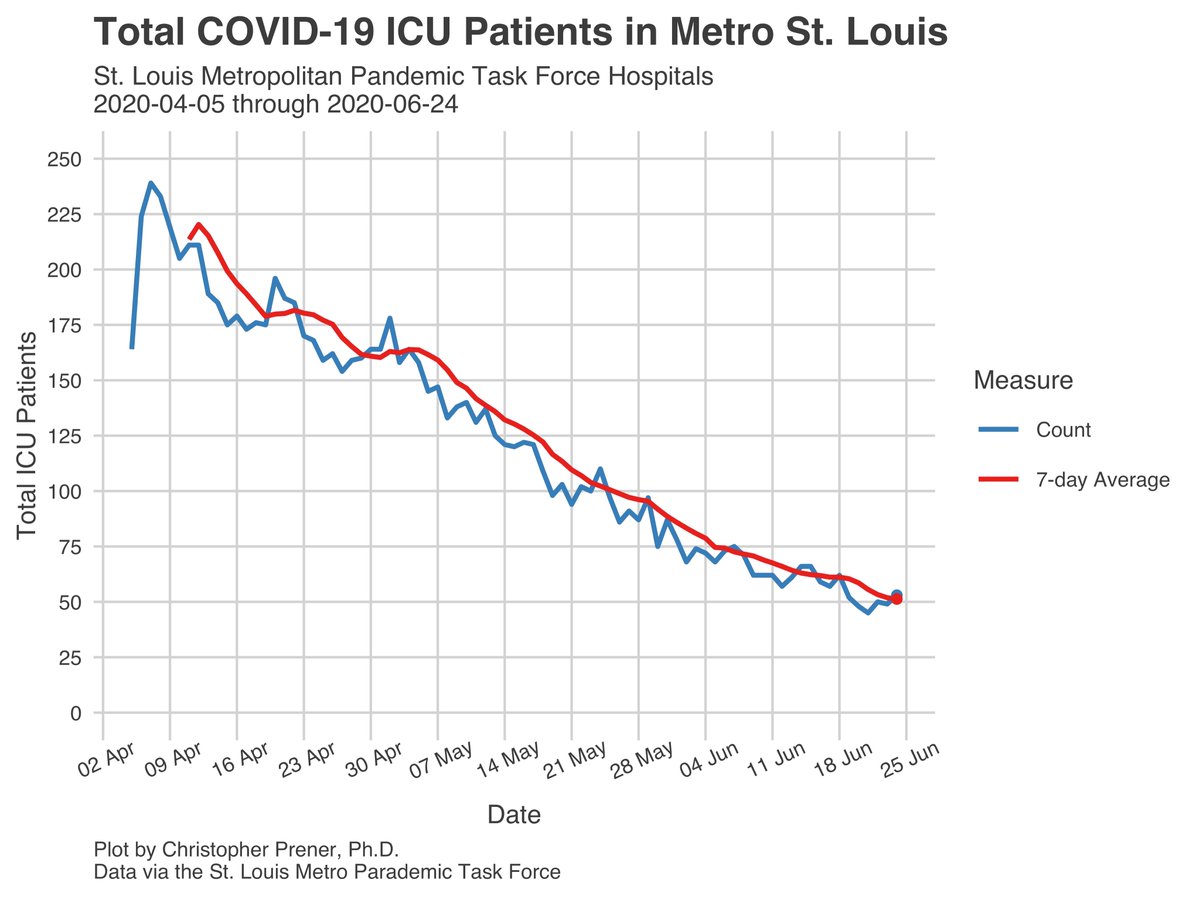
Another metro-level trend worth noting is the continued plateauing of hospitalization metrics in #StLouis, the only region where we have reliable data on hospitalization. Of note - I don’t want to make too much of the upward trend in new patients just yet… 11/15
… I know a number of media outlets are focused on this today, but you can see from that plot just how “noisy” these data are (all the ups and downs - daily variation in new patients). I really want to wait and see if this upward tick in the 7-day average is sustained. 12/15
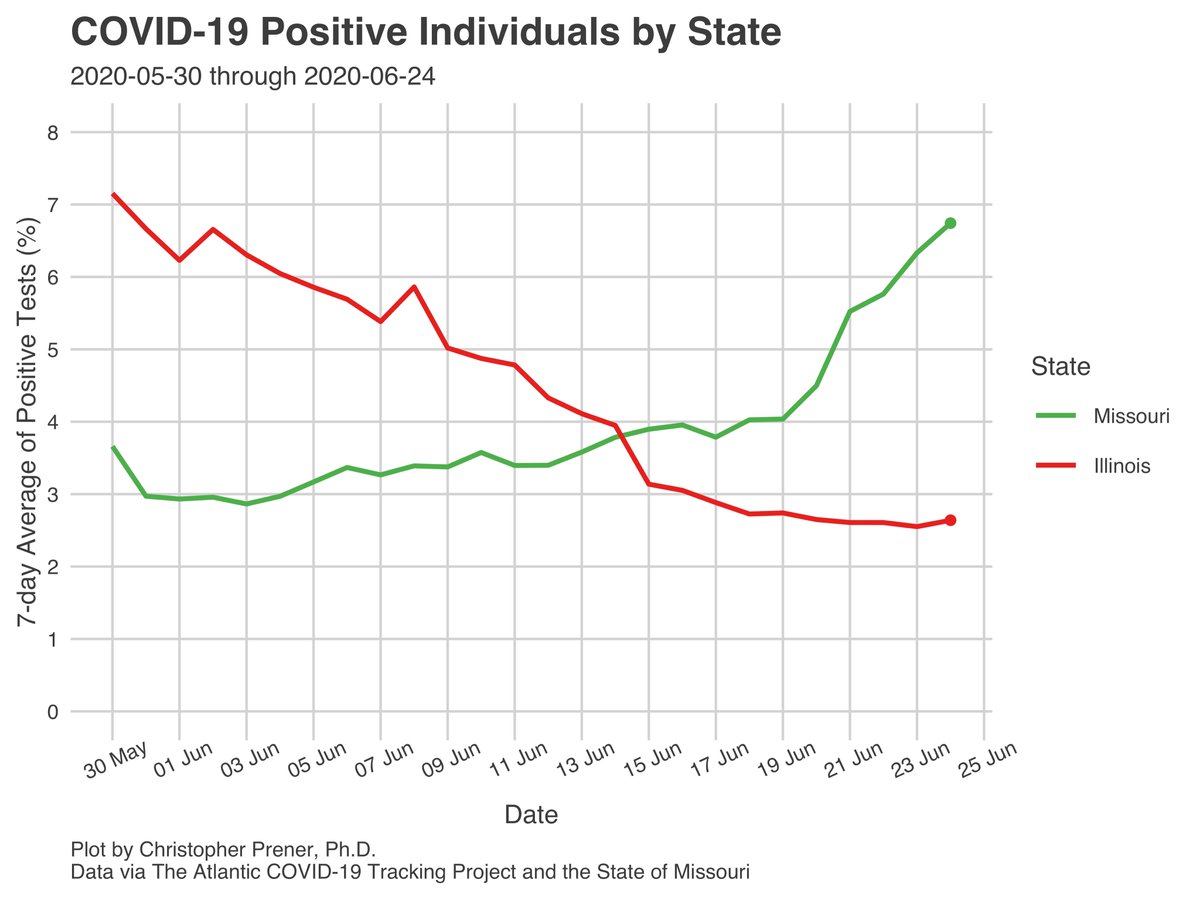
Finally, I want to focus on tonight is testing. The narrative remains the same - our per capita rates are the lowest of the focal states I track, our numbers of new tests have dropped, and our percent of positive individuals is at a peak for June. None of this is good. 13/15
My standard caveats about uncertainty - infections (1) are historical data that reflect infections 2-3 weeks ago, (2) are biased by testing patterns, (3) may include probable but unconfirmed cases in some counties, and (4) rates are not individual probabilities of illness. 14/15
Additional maps and plots are on my tracking site - https://slu-opengis.github.io/covid_daily_viz/.
My #rstats code and and data are all available on @GitHub - https://github.com/slu-openGIS/covid_daily_viz. They're licensed for re-use with attribution, and feedback and improvements are always welcome. 15/15
My #rstats code and and data are all available on @GitHub - https://github.com/slu-openGIS/covid_daily_viz. They're licensed for re-use with attribution, and feedback and improvements are always welcome. 15/15

 Read on Twitter


