The updated probability distribution function of
time intervals from onset of covid-19 symptoms to death based on the Stockholms län data.
A covid-19 thread.
Caution: use with discretion, see the caveats at the
bottom of this thread.
1/
time intervals from onset of covid-19 symptoms to death based on the Stockholms län data.
A covid-19 thread.
Caution: use with discretion, see the caveats at the
bottom of this thread.
1/
The debate continues to smolder as to whether
the daily incidence of covid-19 in the UK dropped
as a result of the Mar23 lockdown or if infections
peaked several days earlier.
2/
the daily incidence of covid-19 in the UK dropped
as a result of the Mar23 lockdown or if infections
peaked several days earlier.
2/
Since the actual nubmer of infections during
the pre-lockdown period is not known, we have to
rely on indirect evidence, for example, the
hospital deaths statistics provided by the NHS.
3/
the pre-lockdown period is not known, we have to
rely on indirect evidence, for example, the
hospital deaths statistics provided by the NHS.
3/
The idea of the method is simple: assuming
it takes the virus t days to kill an
infected person, the number of new cases
on day D should be proportional to
deaths reported on day D+t.
4/
it takes the virus t days to kill an
infected person, the number of new cases
on day D should be proportional to
deaths reported on day D+t.
4/
In reality the time interval from infection to death varies from case to case obeying a certain probability distribution.This makes the reconstruction of indicence from deaths a non-trivial exercise in inverse problem solving (see e.g. https://twitter.com/cheianov/status/1252657345831882760?s=20)
5/
5/
A recent example of a study using this method can
be found here [by Prof Wood, Bristol]
https://arxiv.org/pdf/2005.02090.pdf
(for somewhat overhyped popularisations see here
https://twitter.com/FraserNelson/status/1270737568531955713?s=20
https://www.telegraph.co.uk/news/2020/06/04/coronavirus-infections-england-wales-hit-peak-days-lockdown/
)
I will address this study in detail elsewhere
6/
Any attempt to reconstruct daily incidence from deaths
requires a good knowledge of the probability
distribution function (PDF) of the time intervals from
infection to death. The latter is normally
derived from the PDF of intervals from onset of
symptoms to death,
Pod(t)
7/
requires a good knowledge of the probability
distribution function (PDF) of the time intervals from
infection to death. The latter is normally
derived from the PDF of intervals from onset of
symptoms to death,
Pod(t)
7/
Somewhat suprisingly, even the most recent studies on covid-19 use crude estimates of Pod(T) published more than 3 moths ago and based on Wuhan data from Jan 2020.
The most popular reference is the Verity et al. paper
https://www.thelancet.com/pdfs/journals/laninf/PIIS1473-3099(20)30243-7.pdf
8/
The most popular reference is the Verity et al. paper
https://www.thelancet.com/pdfs/journals/laninf/PIIS1473-3099(20)30243-7.pdf
8/
Verity et al investigate 24 deaths reported on the NHC
website which occurred in Hubei before Feb 8. They assume that Pod(t) is a Gamma distribution and find the best fit. In particular they find the mean interval from onset to death to be tm = 17.8 days [95% CI 16.9-19.2]
9/
website which occurred in Hubei before Feb 8. They assume that Pod(t) is a Gamma distribution and find the best fit. In particular they find the mean interval from onset to death to be tm = 17.8 days [95% CI 16.9-19.2]
9/
An earlier publication by Linton et al. which works with a larger (but not necessarily better) dataset harvested from the internet approximates Pod(t) with the log-normal distribution. It estimates tm=20.2 [15.1-29.5]
10/
10/
Both Verity et al. and Linton et al. adjust their fits for right-truncation, an effect by which in an exponentially increasinng infected population cases with long onset-to-death time are exponentially supressed, therefore the observed Pod(t) lacks the long-time tail.
11/
11/
This publication
https://onlinelibrary.wiley.com/doi/epdf/10.1002/jmv.25891
reports coarse-grained distribution Pod(t) based on the analysis of medical records from Renmin hosp. Adjustment for right-truncation is not done and it is unclear how to do it (a chunk of data came from the post-exponential period)
12/
https://onlinelibrary.wiley.com/doi/epdf/10.1002/jmv.25891
reports coarse-grained distribution Pod(t) based on the analysis of medical records from Renmin hosp. Adjustment for right-truncation is not done and it is unclear how to do it (a chunk of data came from the post-exponential period)
12/
This study investigates medical records from the Tongji Hospital (Wuhan)
https://www.bmj.com/content/368/bmj.m1091
If finds that the median time from onset to death is 16 [12.0-20.0] days. Details of statistical analysis are not given.
13/
https://www.bmj.com/content/368/bmj.m1091
If finds that the median time from onset to death is 16 [12.0-20.0] days. Details of statistical analysis are not given.
13/
This study analyses medical records from Jin Yin-tan and Tongji Hospitals (Wuhan)
https://link.springer.com/article/10.1007/s00134-020-05991-x#additional-information
It gives the details of 68 fatal cases. Tm computed from this data is 18.4 [17.5-19.5] days. It is unclear whether the deaths occurred during the exponential phase
14/
https://link.springer.com/article/10.1007/s00134-020-05991-x#additional-information
It gives the details of 68 fatal cases. Tm computed from this data is 18.4 [17.5-19.5] days. It is unclear whether the deaths occurred during the exponential phase
14/
This early publication also deserves a mention
https://onlinelibrary.wiley.com/doi/full/10.1002/jmv.25689
It estimates the median time from onset to death as 14.0 [6-41] days. The data were collected during the phase of exponential growth, however no right- truncation adjustment is performed.
15/
https://onlinelibrary.wiley.com/doi/full/10.1002/jmv.25689
It estimates the median time from onset to death as 14.0 [6-41] days. The data were collected during the phase of exponential growth, however no right- truncation adjustment is performed.
15/
One can see that the estimated mean/median time from onset of symptoms to death varies significantly between different sources. The main reasons for that are small sample sizes and poorly controlled biases introduced by different data harvesting methods.
16/
16/
In regards to Verity, Linton the further weakness is that they rely on a hypothetical form of the distribution function Pod(t). One can find the best fit of the data
to the postulated function, but the sample size is
simply too small to justify the hypothesis.
17/
to the postulated function, but the sample size is
simply too small to justify the hypothesis.
17/
This problem is exacerbated by right-truncation which in small samples simply erases data points with large enough T. The adjustment procedure cannot restore that information. Effectively, it just fills in this gap of knowledge with an arbitrary speculative model
18/
18/
Apparently, more data is needed. And the good news is
a new very large dataset has just been published.
On June 16 Folkhälsomyndigheten released a report
covering more than 1.6K covid 19-fatalities
in Stockholm area
https://www.folkhalsomyndigheten.se/publicerat-material/publikationsarkiv/t/the-infection-fatality-rate-of-covid-19-in-stockholm-technical-report/
19/
The report is devoted to the estimation of the covid-19 case fatality rate. But for the purposes of this thread we will focus on this chart on page 29
20/
20/
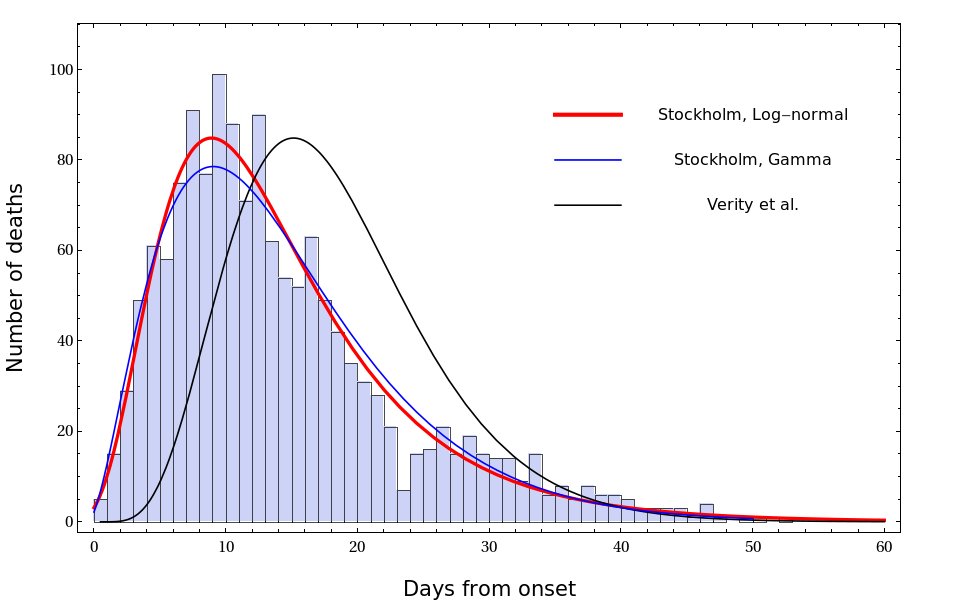
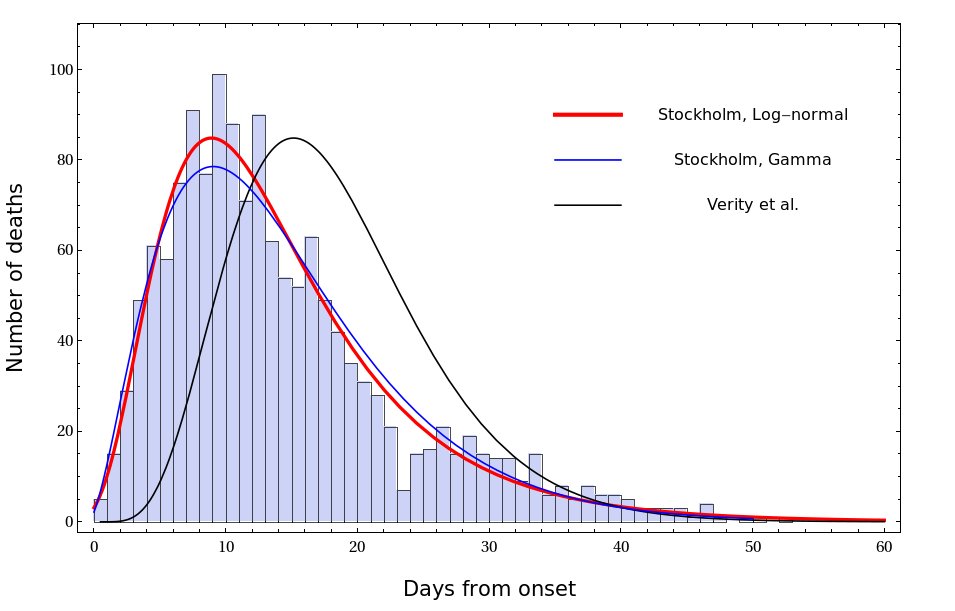
The chart shows the distribution of time periods from onset of symptoms to death for 1470 fatal cases. The chart uses the data up to May 25, about 6 weeks into the plateau, which implies that there is no significant right-truncation effect.
21/
21/
There are many ways to fit the Stockholm data with a smooth curve. The one that I found to work best is a shifted log-normal distribution. The fit is shown in the Fig. The best Gamma fit and the distribution proposed by Verity et al. are shown for comparison
22/
22/
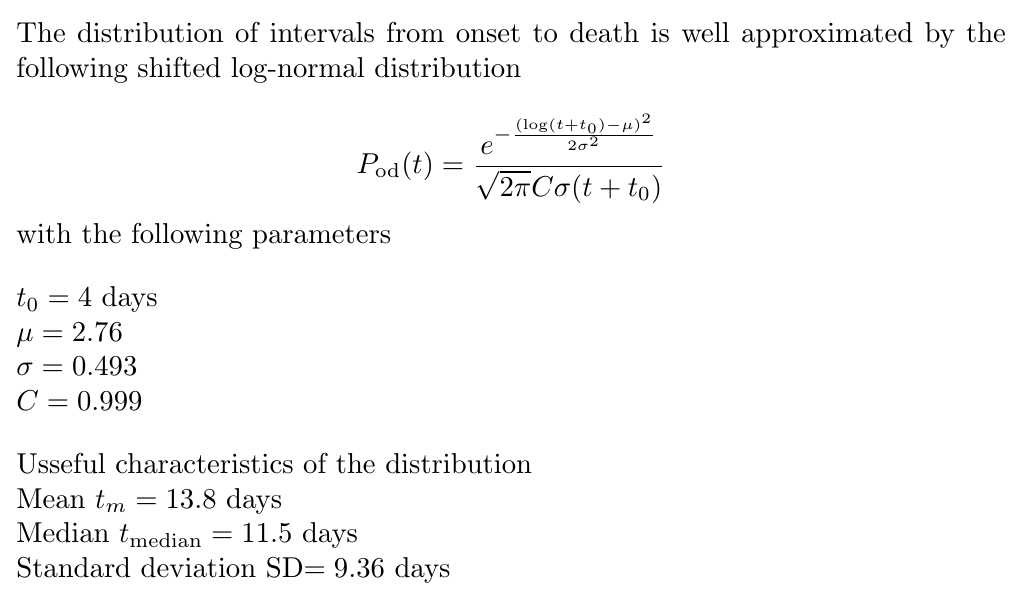
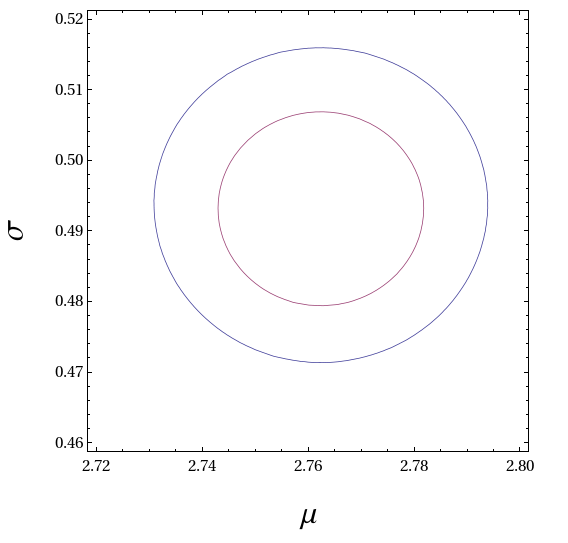
The analytic form and the parameters of the log-normal fit are given below. The figure shows the 68% and 95% confidence contours in the two-dimensional (mu,sigma) parameter space. The normalisation constant C can FAIP be set equal to 1.
23/
23/
The result can, in particular, be used to calculate
the distribution of times from infection to death
Pid(t).
For this we need to know the distriution of incubation
periods, see e.g. here
https://www.acpjournals.org/doi/10.7326/M20-0504#t4-M200504
https://www.mdpi.com/2077-0383/9/2/538
24/
the distribution of times from infection to death
Pid(t).
For this we need to know the distriution of incubation
periods, see e.g. here
https://www.acpjournals.org/doi/10.7326/M20-0504#t4-M200504
https://www.mdpi.com/2077-0383/9/2/538
24/
I assume the distribution of incubation periods Pi(t) to be a log-normal distribution with M=5.5 and SD=2.4.
Calculating the convolution with the Pod(t) (see here
https://twitter.com/cheianov/status/1245834503735533568?s=20) I numerically compute the distribution Pid(t)
25/
Calculating the convolution with the Pod(t) (see here
https://twitter.com/cheianov/status/1245834503735533568?s=20) I numerically compute the distribution Pid(t)
25/
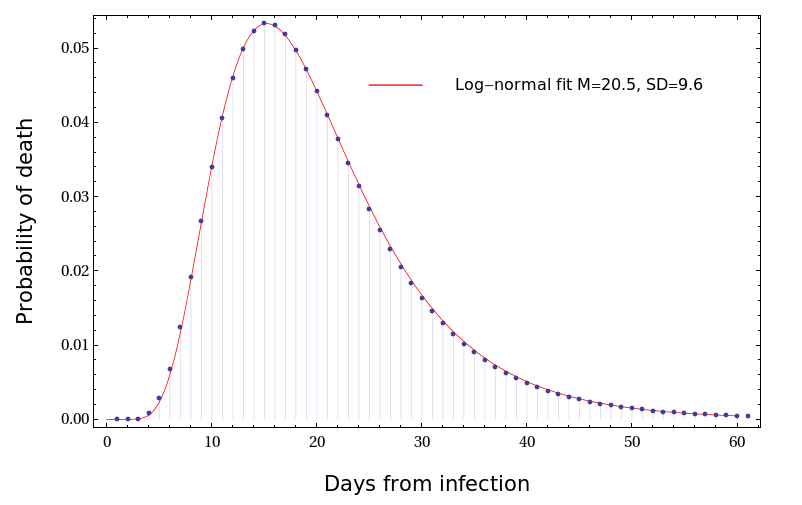
The resulting distribution of time intervals
from infection to death is extremely well approximated
by the lognormal function with mean M=19.8 [18.5-21.8]
days and standard deviation SD=9.9 [8.1-11.7] days.
See Fig.
You are welcome to use this result in your analysis.
26/
from infection to death is extremely well approximated
by the lognormal function with mean M=19.8 [18.5-21.8]
days and standard deviation SD=9.9 [8.1-11.7] days.
See Fig.
You are welcome to use this result in your analysis.
26/
Caveats.
While the dataset supplied by Folkhälsomyndigheten is significantly better than the small biased samples analysed in previous work, it has to be used with caution for the following reasons
27/
While the dataset supplied by Folkhälsomyndigheten is significantly better than the small biased samples analysed in previous work, it has to be used with caution for the following reasons
27/
1. The report has not been peer reviewed.
2. The raw data have not been published.
3. The description of the distribution shown in Fig C3 of the report does not match the figure. E.g., contrary to what the report claims the mean is 14, not 12 days. This is slightly worrying.
28/
2. The raw data have not been published.
3. The description of the distribution shown in Fig C3 of the report does not match the figure. E.g., contrary to what the report claims the mean is 14, not 12 days. This is slightly worrying.
28/
4. Finally, and most alarmingly, one can show that none of the small samples analysed in previous literature have likely been drawn from the same distribution as the
Stockholm data (whether with or without
right-truncation). This is because
29/
Stockholm data (whether with or without
right-truncation). This is because
29/
none (but one) of the previously analysed samples contained cases with t<5, and only one sample of 92 cases contained t=3. In the Stockholm distribution t=4 is an almost exact 10 centile.
30/
30/
This implies that for a sample of 24 cases (Verity)
the odds of having no cases with t<5 are
(1-0.1)^{-24}= 12/1 against w/o right-truncation
and 725/1 with right-truncation
31/
the odds of having no cases with t<5 are
(1-0.1)^{-24}= 12/1 against w/o right-truncation
and 725/1 with right-truncation
31/
For this study
https://link.springer.com/article/10.1007/s00134-020-05991-x#additional-information
the odds that the sample is drawn from the Stockholm distribution are 1300 to 1 against even w/o
right-truncation. 32/
https://link.springer.com/article/10.1007/s00134-020-05991-x#additional-information
the odds that the sample is drawn from the Stockholm distribution are 1300 to 1 against even w/o
right-truncation. 32/
We see that for some reason samples drawn from Wuhan data are in stark disagreement with the Stockholm distribution. Any information/ideas that could help resolve this mystery are welcome.
33/
33/
Summary: in this thread I use a large dataset from Stockholm county to refine the parameters of a function needed for the analysis of questions such as the IFR of covid-19 or hindcasting the response of covid R-rate to the state interventions. More to follow...
34/ENDS
34/ENDS
Note: the PDF shown in the tweet 1 has a slightly different set of parameters than the one shown in tweet 26. This is because two slightly different distributions of incubation times have been used. The uncertainty is absorbed into the confidence intervals given in tweet 26.

 Read on Twitter
![Verity et al investigate 24 deaths reported on the NHC website which occurred in Hubei before Feb 8. They assume that Pod(t) is a Gamma distribution and find the best fit. In particular they find the mean interval from onset to death to be tm = 17.8 days [95% CI 16.9-19.2]9/ Verity et al investigate 24 deaths reported on the NHC website which occurred in Hubei before Feb 8. They assume that Pod(t) is a Gamma distribution and find the best fit. In particular they find the mean interval from onset to death to be tm = 17.8 days [95% CI 16.9-19.2]9/](https://pbs.twimg.com/media/EbSUc5ZX0AA_2Yc.jpg)

![The resulting distribution of time intervals from infection to death is extremely well approximated by the lognormal function with mean M=19.8 [18.5-21.8] days and standard deviation SD=9.9 [8.1-11.7] days. See Fig.You are welcome to use this result in your analysis. 26/ The resulting distribution of time intervals from infection to death is extremely well approximated by the lognormal function with mean M=19.8 [18.5-21.8] days and standard deviation SD=9.9 [8.1-11.7] days. See Fig.You are welcome to use this result in your analysis. 26/](https://pbs.twimg.com/media/EbSjj1qXsAALJv1.png)