Okay, let’s do a thing!
One like of this tweet = one web perf tip. Loading perf, runtime perf, whatever
One like of this tweet = one web perf tip. Loading perf, runtime perf, whatever

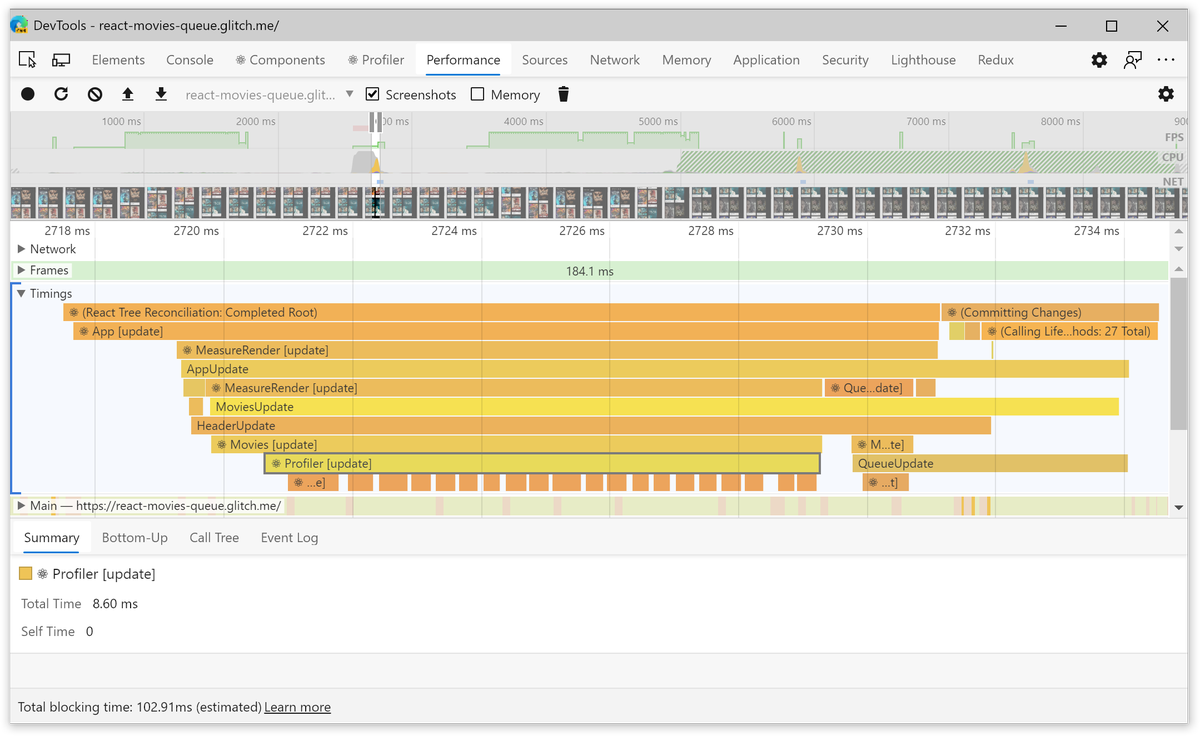
1) If you do a perf recording of a React app (in the dev mode), the perf trace will include the Timings section.
In Timings, you can see what components were rendered, and when. Useful to debug unnecessary renders:
In Timings, you can see what components were rendered, and when. Useful to debug unnecessary renders:
(Unfortunately, React is removing that due to complexity: https://github.com/facebook/react/pull/18417. But it’s still available in the most part of React 16.x)
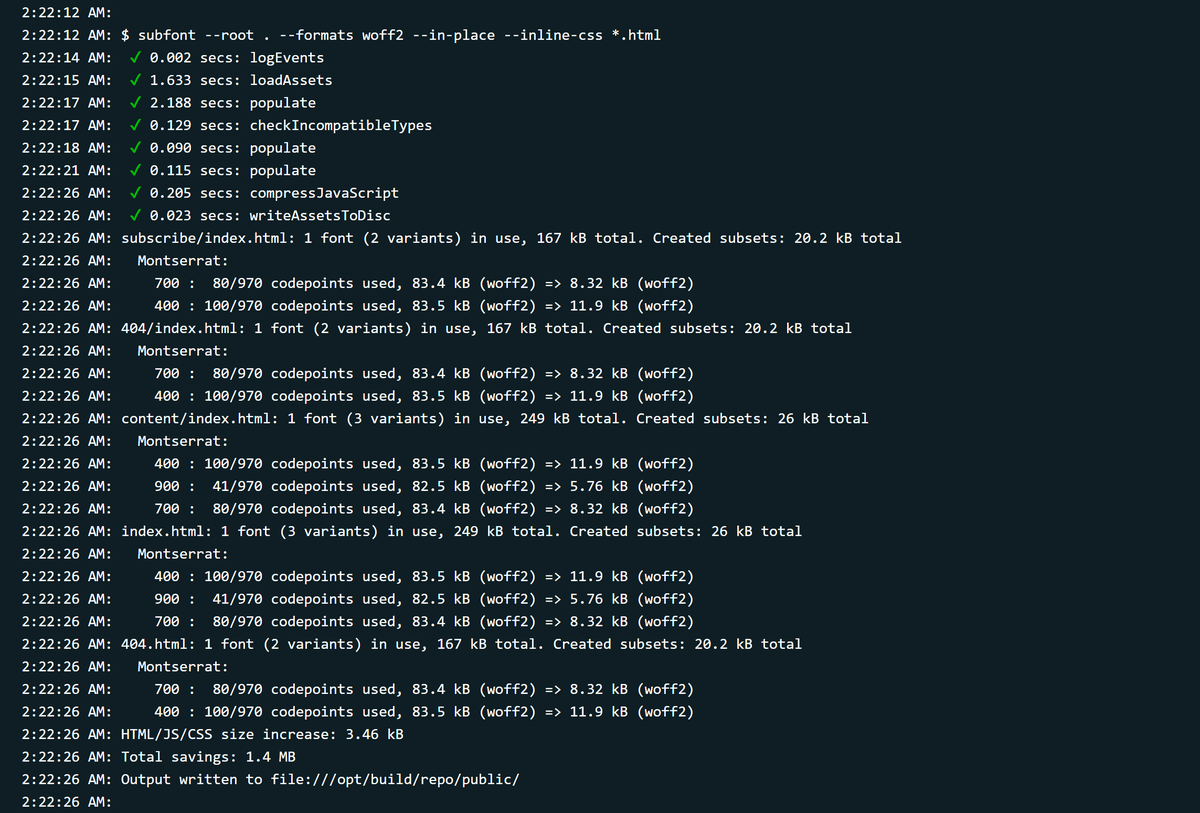
2) Have a static site? Serving fonts from your own server?
Subset these fonts to characters that are actually used on your pages. This will help to load fonts faster.
You can easily do this at the build time using
— https://www.npmjs.com/package/subfont or
— https://github.com/filamentgroup/glyphhanger
Subset these fonts to characters that are actually used on your pages. This will help to load fonts faster.
You can easily do this at the build time using
— https://www.npmjs.com/package/subfont or
— https://github.com/filamentgroup/glyphhanger
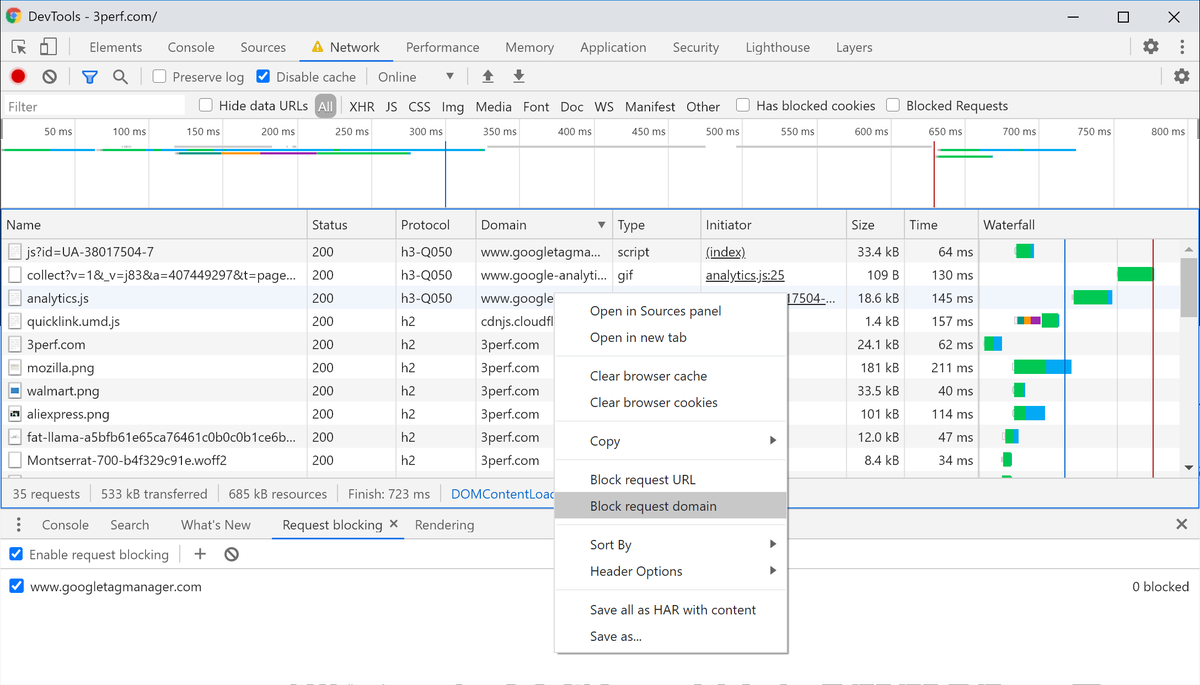
3) Want to measure how much Google Analytics or other third parties affect your site’s speed?
That’s easy to do with Chrome DevTools.
Go to Network → Sort by domain → Right-click each third-party → Select "Block request domain".
Then, just run a Lighthouse audit and compare
That’s easy to do with Chrome DevTools.
Go to Network → Sort by domain → Right-click each third-party → Select "Block request domain".
Then, just run a Lighthouse audit and compare
4) Use Gatsby and have a mostly static site? A great way to make it faster is to remove Gatsby’s JavaScript from all static pages.
You can do this with gatsby-plugin-no-javascript:
You can do this with gatsby-plugin-no-javascript:
5) If you’re using Cloudflare, for $20/mo, you can compress all your images automatically. And even convert them to webp if the browser supports that.
Just enable the Polish option: https://support.cloudflare.com/hc/en-us/articles/360000607372-Using-Cloudflare-Polish-to-compress-images
Just enable the Polish option: https://support.cloudflare.com/hc/en-us/articles/360000607372-Using-Cloudflare-Polish-to-compress-images
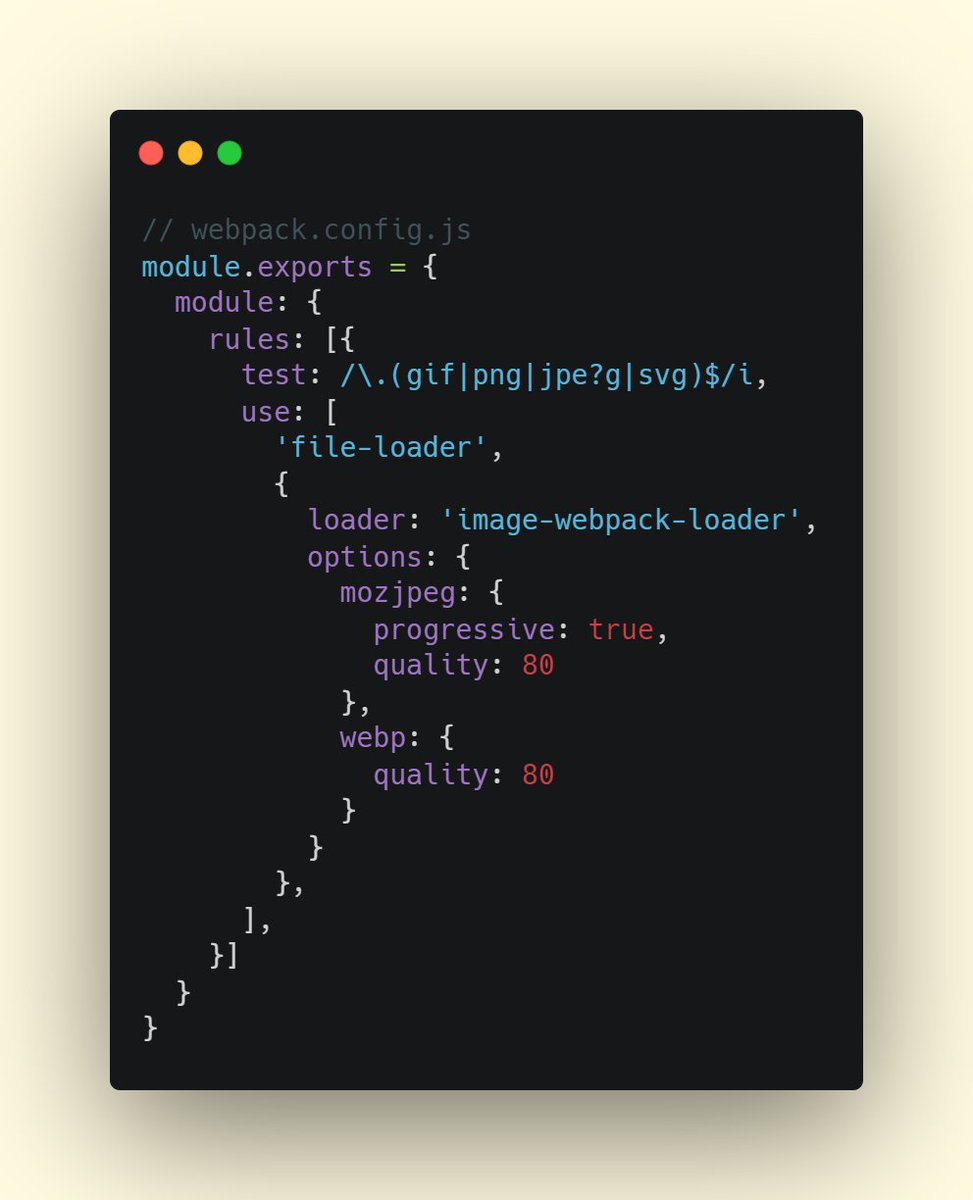
6) Another way to load your images faster is to use image-webpack-loader.
Plug this loader in front of url-loader or file-loader, and it will compress and optimize your images as needed ↓
https://www.npmjs.com/package/image-webpack-loader
Plug this loader in front of url-loader or file-loader, and it will compress and optimize your images as needed ↓
https://www.npmjs.com/package/image-webpack-loader
7) *Yet another* way to speed up your images is to serve smaller pictures on smaller screens. There’s no need to load a 4K image for an iPhone SE screen, right?
For this, use <img srcset> and webpack’s responsive-loader:
For this, use <img srcset> and webpack’s responsive-loader:
8) Okay, let’s talk DevTools.
If your app lags when you click something, it’s likely doing too much work.
Sometimes, this work is "repainting too much on the screen". The easy way to debug unnecessary repaints is More tools → Rendering → Paint Flashing:
If your app lags when you click something, it’s likely doing too much work.
Sometimes, this work is "repainting too much on the screen". The easy way to debug unnecessary repaints is More tools → Rendering → Paint Flashing:
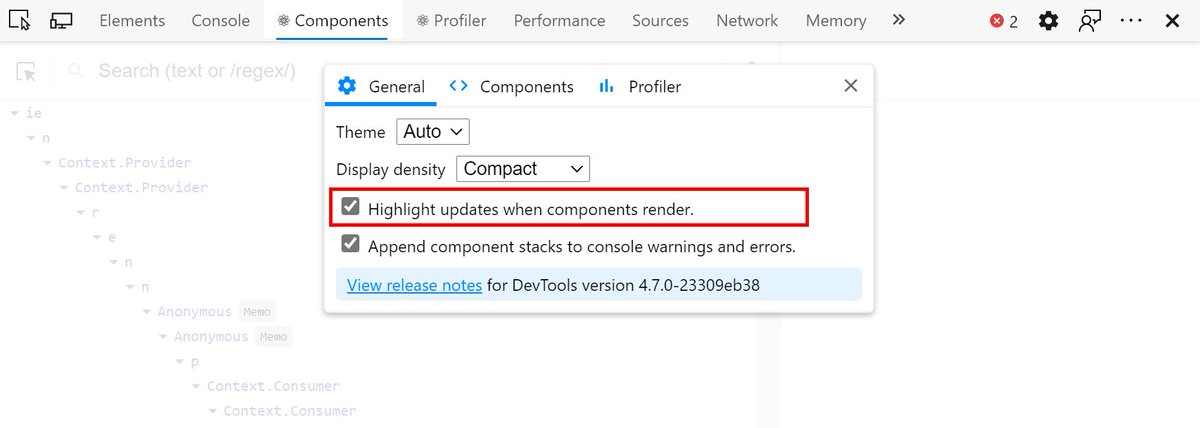
9) React DevTools have a similar setting that highlights all component renders.
Go to React DevTools settings and check "Highlight updates...". Now, whenever you do something, every component that re-renders will flash for a bit.
Super useful for debugging unnecessary rerenders
Go to React DevTools settings and check "Highlight updates...". Now, whenever you do something, every component that re-renders will flash for a bit.
Super useful for debugging unnecessary rerenders
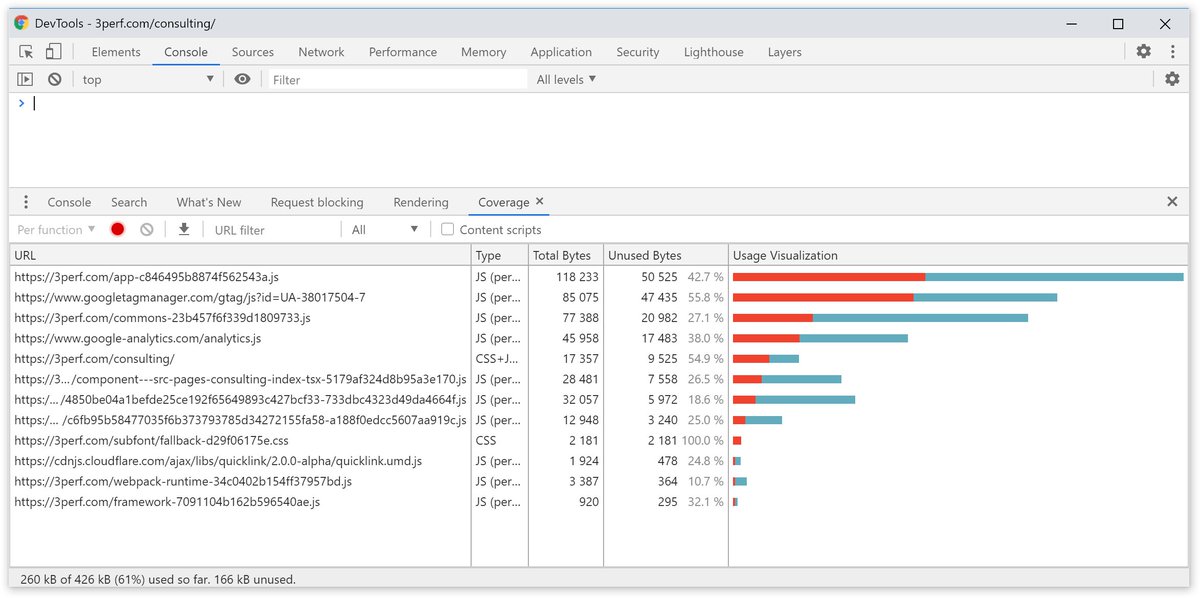
10) Want to see if you’re doing code splitting well enough?
Go to your app. Then, open DevTools → Ctrl/⌘+P → Coverage → "Start instrumenting...".
You’ll see how much of your CSS and JS has been actually used for rendering the page:
Go to your app. Then, open DevTools → Ctrl/⌘+P → Coverage → "Start instrumenting...".
You’ll see how much of your CSS and JS has been actually used for rendering the page:
11) Courtesy of @tkadlec:
To check whether any of your resources are missing gzip/Brotli compression, type `-has-response-header: Content-Encoding` into the filter in the Network panel: https://twitter.com/iamakulov/status/1197859184676659200
To check whether any of your resources are missing gzip/Brotli compression, type `-has-response-header: Content-Encoding` into the filter in the Network panel: https://twitter.com/iamakulov/status/1197859184676659200
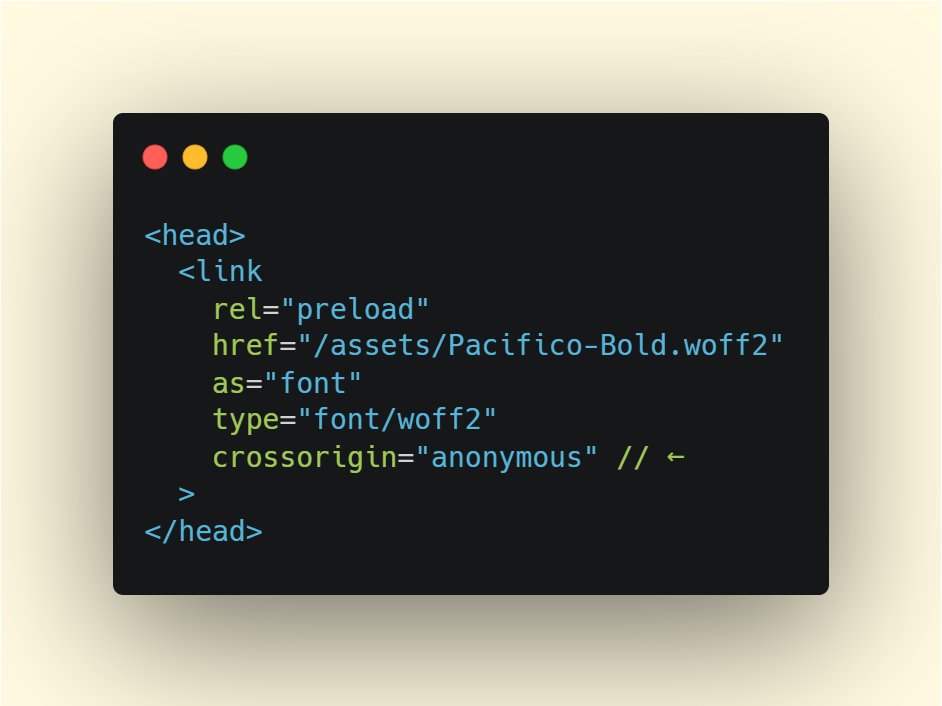
12) If you’re preloading fonts, make sure you use the crossorigin="anonymous" attribute.
Due to CORS trickery, without that attribute, preloaded fonts will be ignored ( https://github.com/w3c/preload/issues/32)
Due to CORS trickery, without that attribute, preloaded fonts will be ignored ( https://github.com/w3c/preload/issues/32)
(Shameless plug: if you’d love to learn more of these tips & how they apply to your app or site, see https://3perf.com/consulting/ )
13) Have a static site? Want to make navigation faster? Add http://getquick.link or http://instantclick.io .
— instant-click preloads links when the visitor hovers them (this gives a 100-300 ms head start)
— quicklink goes further and preloads all links within the viewport
— instant-click preloads links when the visitor hovers them (this gives a 100-300 ms head start)
— quicklink goes further and preloads all links within the viewport
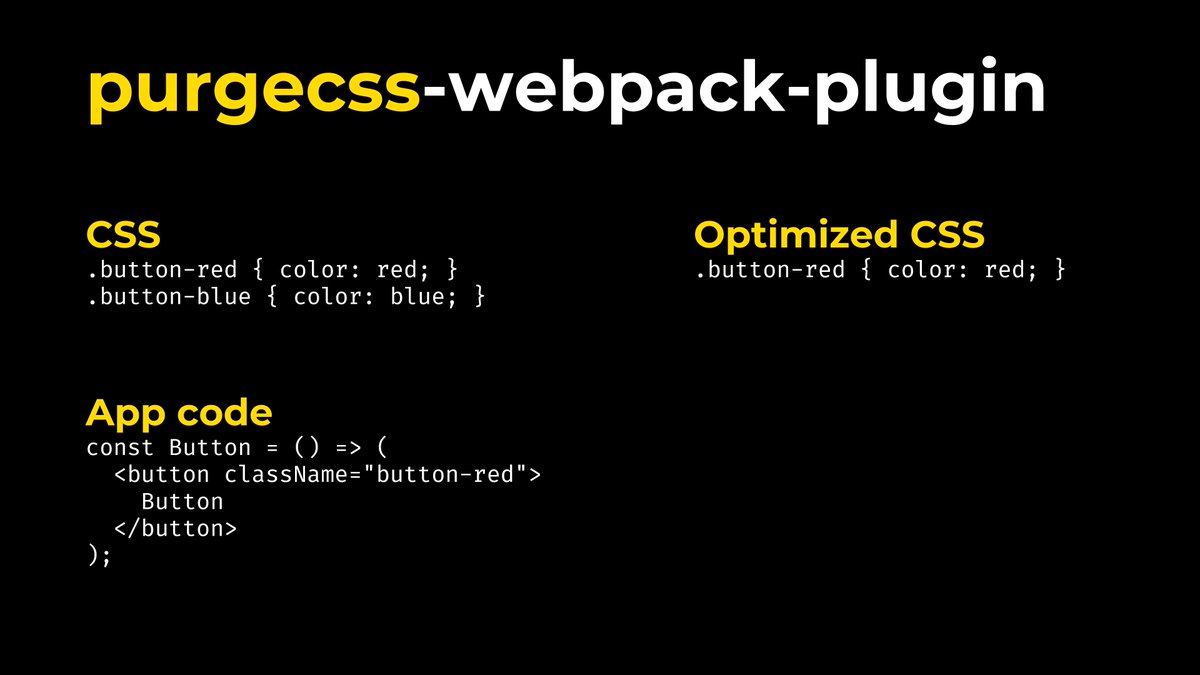
14) Use Bootstrap or another CSS framework? It’s likely you’re serving a lot of CSS that you don’t use.
Add purgecss-webpack-plugin to your webpack config to remove unused classes ↓
https://www.npmjs.com/package/purgecss-webpack-plugin
Add purgecss-webpack-plugin to your webpack config to remove unused classes ↓
https://www.npmjs.com/package/purgecss-webpack-plugin
15) A great way to speed up custom fonts is to use `font-display`.
By default, any text that uses custom fonts isn’t visible until these fonts load (or up to 3s). This is a subpar UX.
You can change that by setting the `font-display` rule in your CSS: https://font-display.glitch.me/
By default, any text that uses custom fonts isn’t visible until these fonts load (or up to 3s). This is a subpar UX.
You can change that by setting the `font-display` rule in your CSS: https://font-display.glitch.me/
16) Google Fonts have been supporting `font-display` for a year.
But if your site is older, it’s likely you don’t have it enabled.
Make sure you Google Fonts URL has the `&display=swap` (or another value) parameter to get font-display benefits:
But if your site is older, it’s likely you don’t have it enabled.
Make sure you Google Fonts URL has the `&display=swap` (or another value) parameter to get font-display benefits:
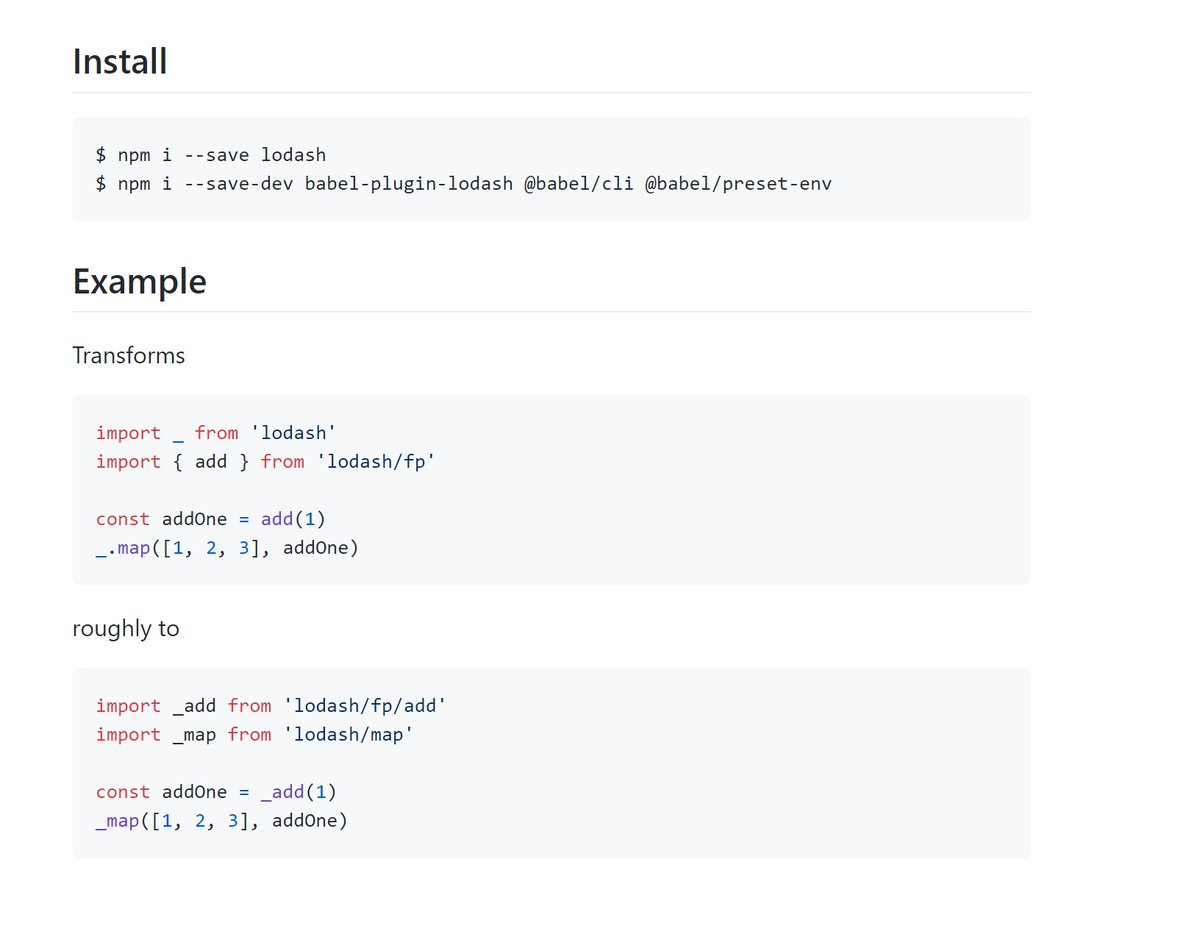
17) Using Lodash? Make sure your Babel config has babel-plugin-lodash.
babel-plugin-lodash transforms your Lodash imports to make sure you’re only bundling methods that you actually use (= 10-20 functions instead of 300).
babel-plugin-lodash transforms your Lodash imports to make sure you’re only bundling methods that you actually use (= 10-20 functions instead of 300).
18) Using Lodash? Try aliasing `lodash-es` to `lodash` (or vice versa). E.g., with webpack ↓
A common issue in bundles I’ve seen is different dependencies using different Lodash versions. This leads to Lodash being bundled multiple times.
A common issue in bundles I’ve seen is different dependencies using different Lodash versions. This leads to Lodash being bundled multiple times.
Using Moment.js? Try replacing it with Day.js.
Day.js has the similar API, also supports locales, but is orders of magnitude smaller: https://github.com/iamkun/dayjs
Day.js has the similar API, also supports locales, but is orders of magnitude smaller: https://github.com/iamkun/dayjs
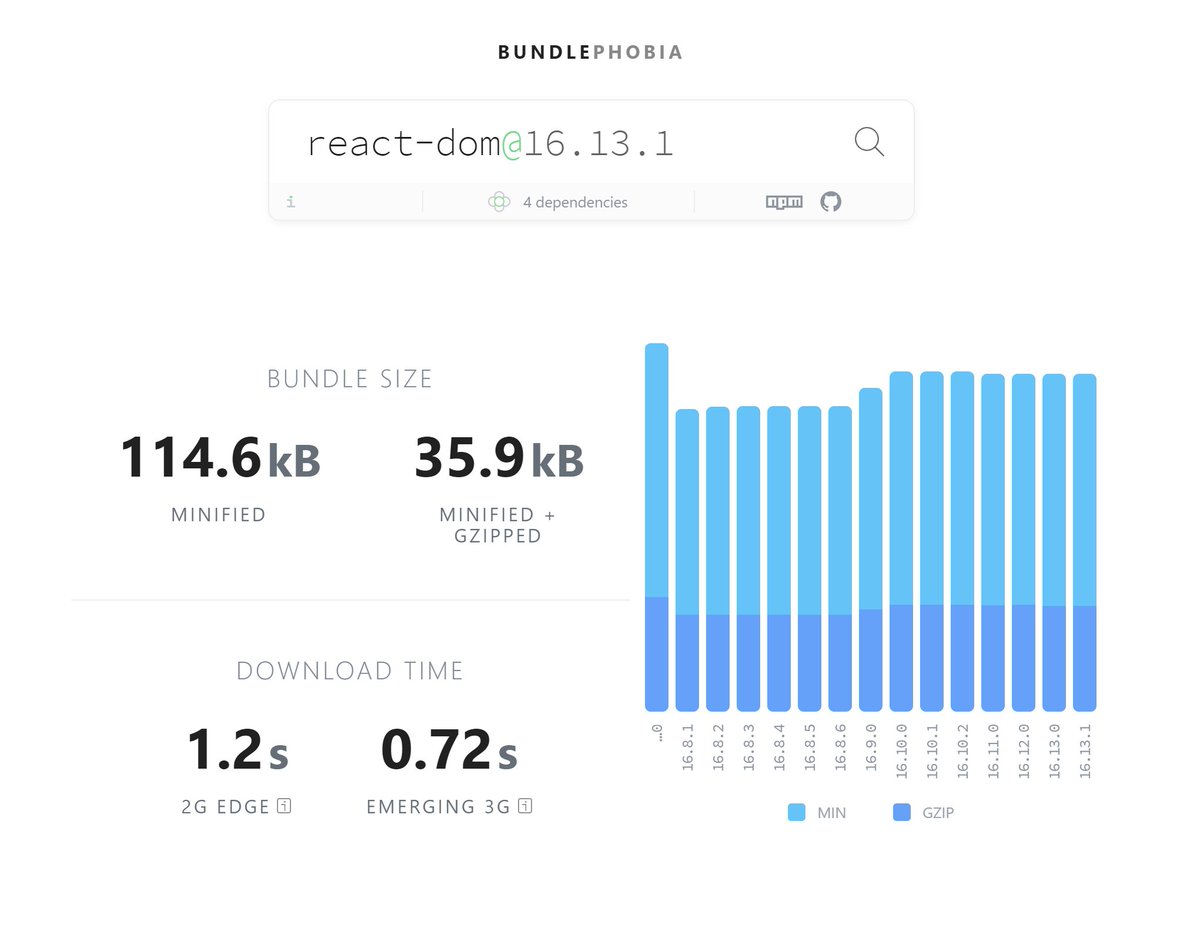
20) Using React? Try replacing it with preact + preact-compat.
In a lot of bundles I’ve seen, react-dom is the single largest dependency. Just by removing it, you can reduce your load time quite significantly.
In a lot of bundles I’ve seen, react-dom is the single largest dependency. Just by removing it, you can reduce your load time quite significantly.
I’ve got to admit, I’ve been doubtful about this optimization for a while – mostly due to compatibility concerns. Like, what if I replace React with Preact, and it breaks something?
But then, I did this at http://3perf.com . And it was seamless. I have yet to see any bugs.
But then, I did this at http://3perf.com . And it was seamless. I have yet to see any bugs.
21) /* #__PURE__*/
This is my favorite conference trick.
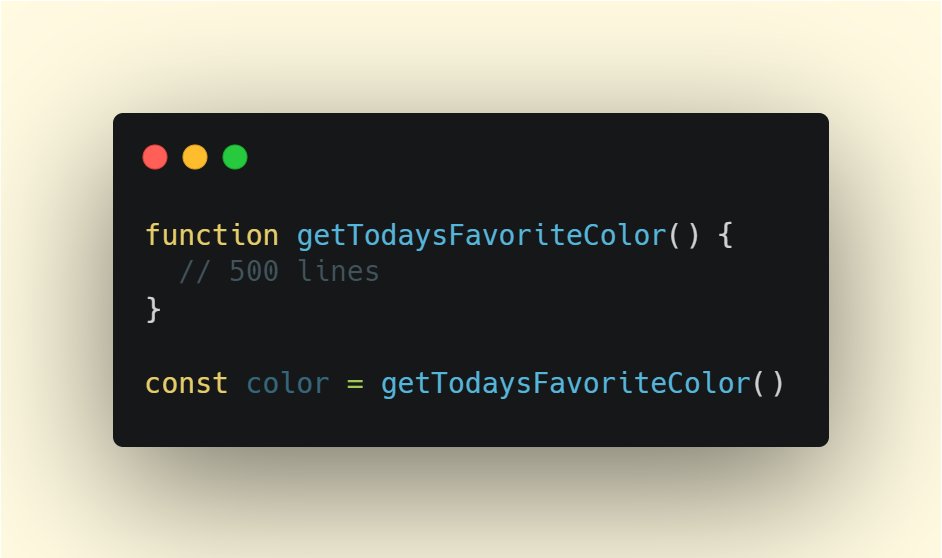
If you have a function that you
— call once,
— store its result in a variable,
— and then don’t use that variable –
tree-shaking will remove the variable, but *not* the function.
This is my favorite conference trick.
If you have a function that you
— call once,
— store its result in a variable,
— and then don’t use that variable –
tree-shaking will remove the variable, but *not* the function.
That’s because the function can have any side effects (e.g. what if it sends something to the server?), and removing it might break the app.
However, if the function doesn’t have side effects, this’d mean it’s kept in the bundle unnecessarily.
However, if the function doesn’t have side effects, this’d mean it’s kept in the bundle unnecessarily.
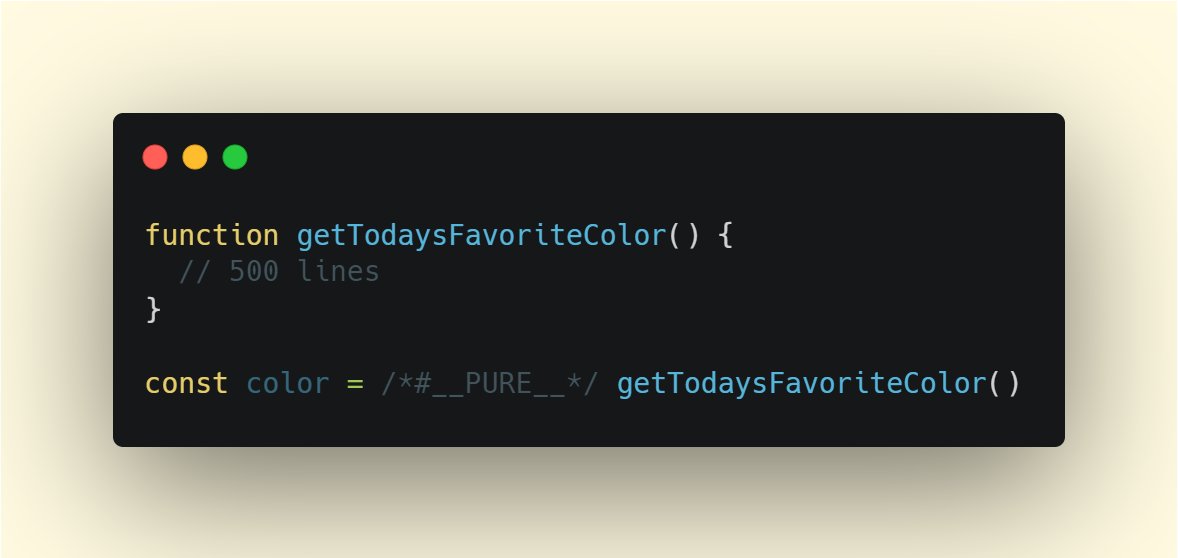
To remove such function when its result is not used, prepend the function call with /* #__PURE__*/:
This is supported by Uglify, Terser, and a few other tools – and it tells them that it’s safe to remove `getTodaysFavoriteColor()` if `color` is not used.
This is supported by Uglify, Terser, and a few other tools – and it tells them that it’s safe to remove `getTodaysFavoriteColor()` if `color` is not used.
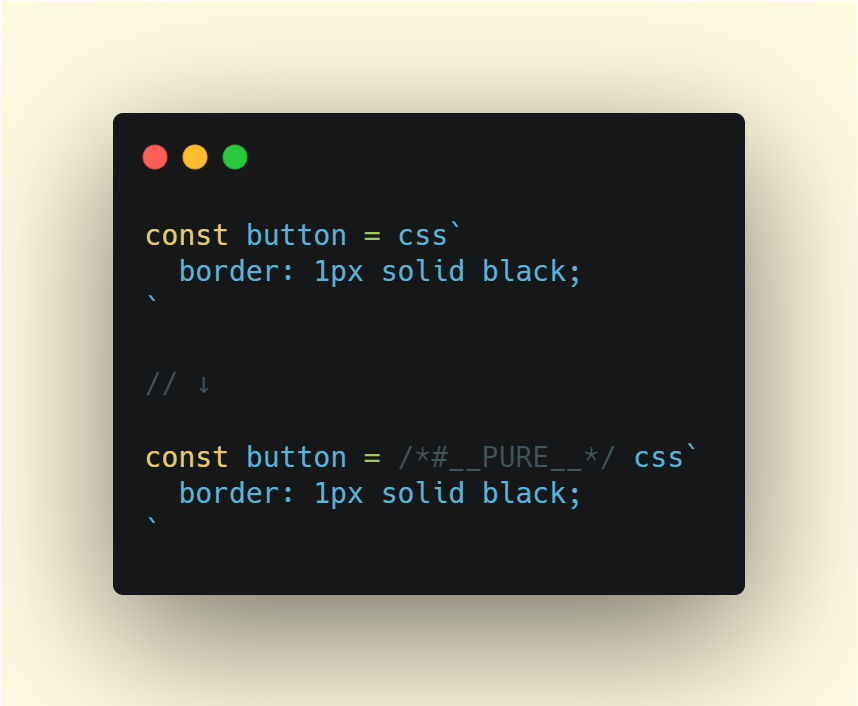
22) BTW, that’s also why you should use babel-plugin-styled-components with styled-components (and similar plugins with other libs).
These plugins prepend /* #__PURE__*/ in front of CSS-in-JS declarations. Without them, unused CSS rules won’t be deleted from the bundle.
These plugins prepend /* #__PURE__*/ in front of CSS-in-JS declarations. Without them, unused CSS rules won’t be deleted from the bundle.
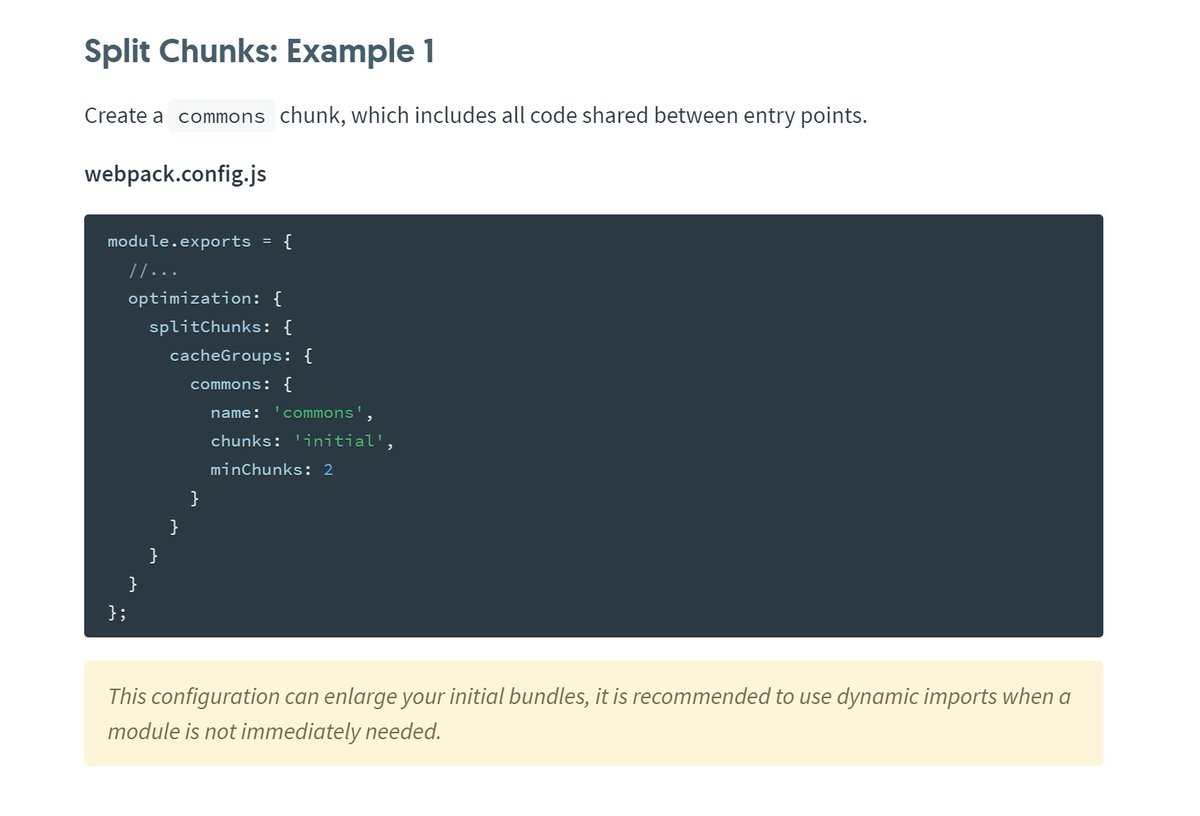
23) If you use webpack with HTMLWebpackPlugin, make sure to enable `optimization.splitChunks: 'all'`: https://webpack.js.org/plugins/split-chunks-plugin/
This would make webpack automatically code-split your entry bundles for better caching.
This would make webpack automatically code-split your entry bundles for better caching.
(This is useful without HTMLWebpackPlugin as well. But it’s super convenient with it because HTMLWebpackPlugin takes care of including all necessary bundles.)
24) Also, set `optimization.runtimeChunk: true`: https://webpack.js.org/configuration/optimization/#optimizationruntimechunk
This would move webpack’s runtime into a separate chunk – and would also improve caching.
This would move webpack’s runtime into a separate chunk – and would also improve caching.
25) *If* you’re doing manual code splitting (= import() or multiple entries), *do not* code-split node_modules into a vendor bundle. I.e., *do not* do this ↓
Yes, this example is present it docs. But with multiple chunks, it’s harmful.
If any of your chunks uses a large dependency (e.g., moment), this dep would be moved into the vendor bundle. And *all* pages of your app will have to load it.
Instead, code-split common modules:
If any of your chunks uses a large dependency (e.g., moment), this dep would be moved into the vendor bundle. And *all* pages of your app will have to load it.
Instead, code-split common modules:
Here’s a great case study about Next.js and Gastby covering this topic: https://web.dev/granular-chunking-nextjs/
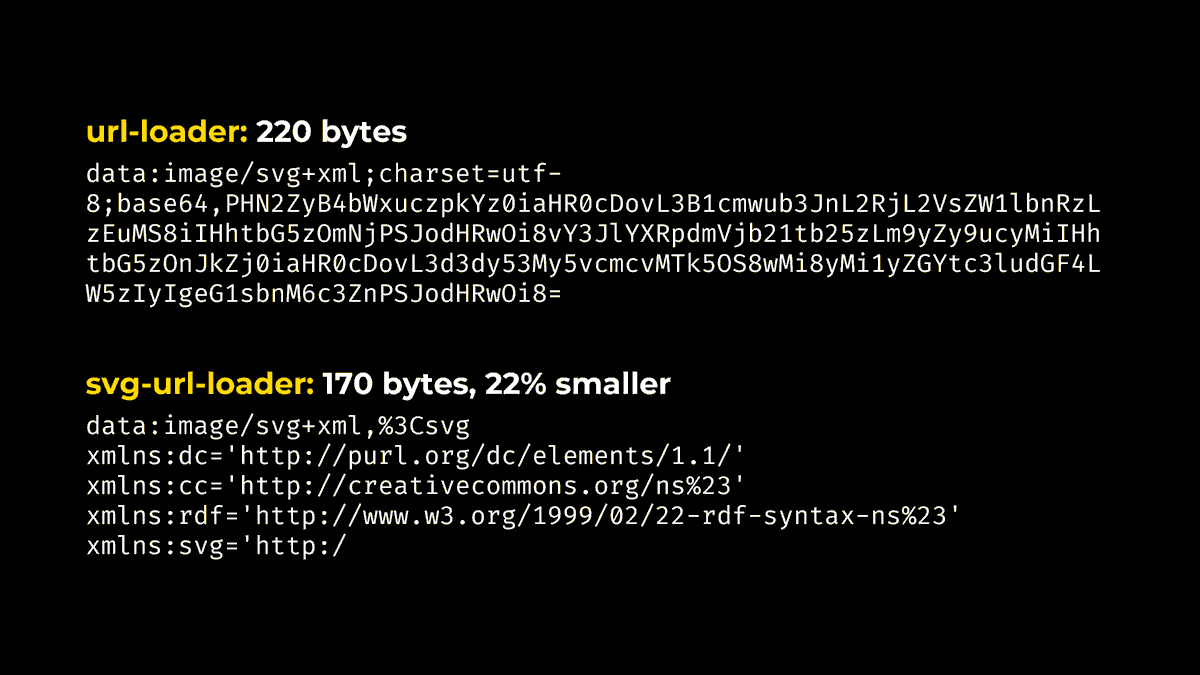
26) If you’re inlining svgs into the bundle, use svg-url-loader: https://www.npmjs.com/package/svg-url-loader
base64-encoded resources are, on average, 37% larger than original assets due to limited alphabet.
svg-url-loader encodes svgs using URL encoding, so svgs don’t suffer from that:
base64-encoded resources are, on average, 37% larger than original assets due to limited alphabet.
svg-url-loader encodes svgs using URL encoding, so svgs don’t suffer from that:
27) But, also: if you’re inlining svgs into the bundle, run webpack-bundle-analyzer and confirm you’re not inlining *too many* of them.
This is frequent with svg icons. Each icon might be small (1-2KB), but when there’re 200 icons, suddenly, that affects the bundle a lot.
This is frequent with svg icons. Each icon might be small (1-2KB), but when there’re 200 icons, suddenly, that affects the bundle a lot.
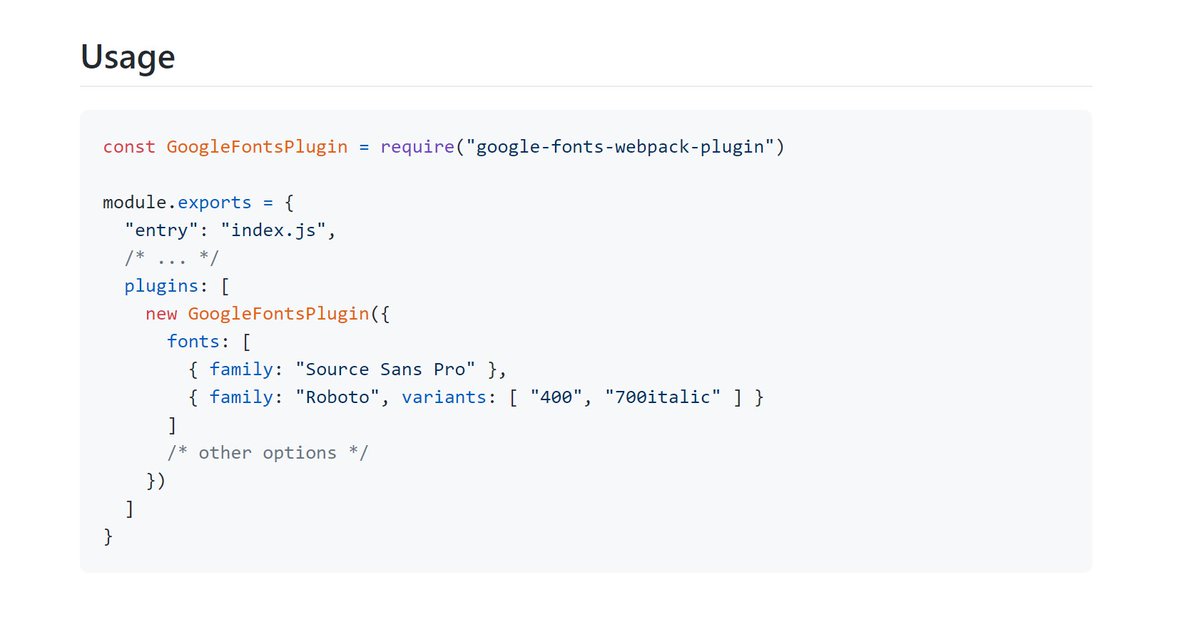
28) Using Google Fonts and HTMLWebpackPlugin? Self-host these fonts with google-fonts-webpack-plugin.
The plugin downloads font files – so you can serve them from your server.
This makes fonts load faster – as the browser doesn’t have to set up a new connection to Google Fonts.
The plugin downloads font files – so you can serve them from your server.
This makes fonts load faster – as the browser doesn’t have to set up a new connection to Google Fonts.
29) Want to preload all your webpack assets ahead of time? Or even make the app work offline? Use workbox-webpack-plugin: https://www.npmjs.com/package/workbox-webpack-plugin
The plugin will generate a service worker – which, with a couple of flags, can do any of these things.
The plugin will generate a service worker – which, with a couple of flags, can do any of these things.
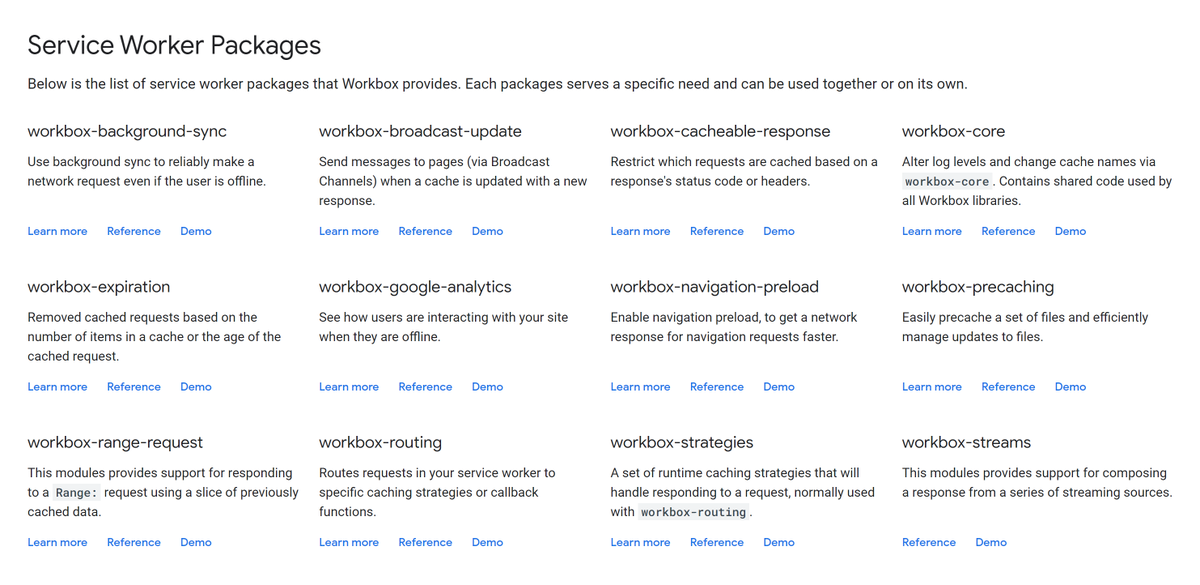
30) While we’re on the same page: workbox is 
If you wanted to add a service worker to your app but were always pushed away by the complexity, check out Google’s workbox library: https://developers.google.com/web/tools/workbox
It puts all common SV usage patterns behind a simple interface.

If you wanted to add a service worker to your app but were always pushed away by the complexity, check out Google’s workbox library: https://developers.google.com/web/tools/workbox
It puts all common SV usage patterns behind a simple interface.
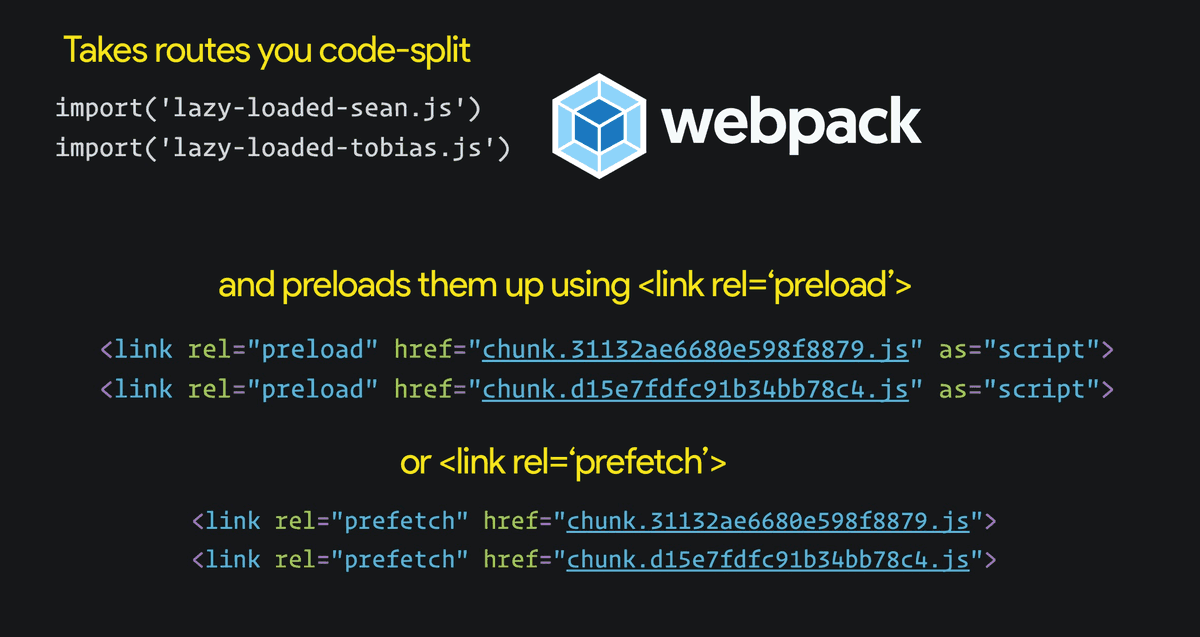
31) Want to preload webpack assets but not ready for a full-blown service worker? Then try preload-webpack-plugin: https://www.npmjs.com/package/preload-webpack-plugin
This plugin works with HTMLWebpackPlugin and generates <link rel="preload/prefetch"> for all JS chunks:
This plugin works with HTMLWebpackPlugin and generates <link rel="preload/prefetch"> for all JS chunks:
32) BTW, if you’re using webpack, it’s likely all your JS/CSS/images/etc have a hash in their name. E.g.:
/static/bundle-eaba706f.js
/static/d7517738.jpg
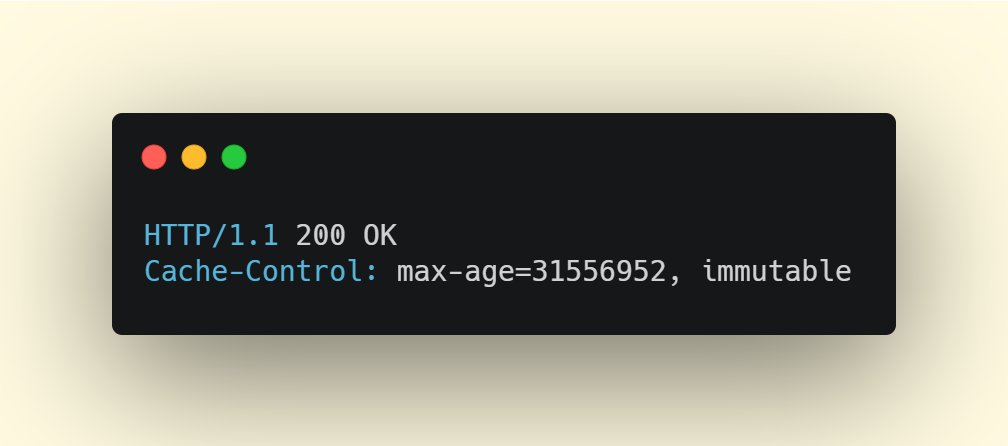
You can improve caching of such assets with the `Cache-Control: immutable` header. More info: https://bitsup.blogspot.com/2016/05/cache-control-immutable.html
/static/bundle-eaba706f.js
/static/d7517738.jpg
You can improve caching of such assets with the `Cache-Control: immutable` header. More info: https://bitsup.blogspot.com/2016/05/cache-control-immutable.html
33) And here’s how you typically do caching, anyway: https://twitter.com/iamakulov/status/1259763674409033735
34) Your CSS consists of two parts:
— what’s needed for initial rendering
— and what’s not
The second part is typically larger – and it’s not needed for the first render! This means it just adds a delay. To split these parts & remove the delay, use https://github.com/addyosmani/critical
— what’s needed for initial rendering
— and what’s not
The second part is typically larger – and it’s not needed for the first render! This means it just adds a delay. To split these parts & remove the delay, use https://github.com/addyosmani/critical
This approach is called "Critical CSS". More about it: https://3perf.com/talks/web-perf-101/#critical-css
35) CSS-in-JS has its drawbacks, but one of its benefits is that it typically supports Critical CSS out of the box. (CSS modules is a notable exception.)
So if you’re using styled-components (or smth similar), there’s no need to use `critical` on top of that.
So if you’re using styled-components (or smth similar), there’s no need to use `critical` on top of that.
36) If you use styled-components or emotion, try replacing them with linaria: https://www.npmjs.com/package/linaria
Both styled-component and emotion have a runtime, and that brings runtime performance costs ( https://calendar.perfplanet.com/2019/the-unseen-performance-costs-of-css-in-js-in-react-apps/).
Linaria is a 0-runtime alternative with a similar API:
Both styled-component and emotion have a runtime, and that brings runtime performance costs ( https://calendar.perfplanet.com/2019/the-unseen-performance-costs-of-css-in-js-in-react-apps/).
Linaria is a 0-runtime alternative with a similar API:
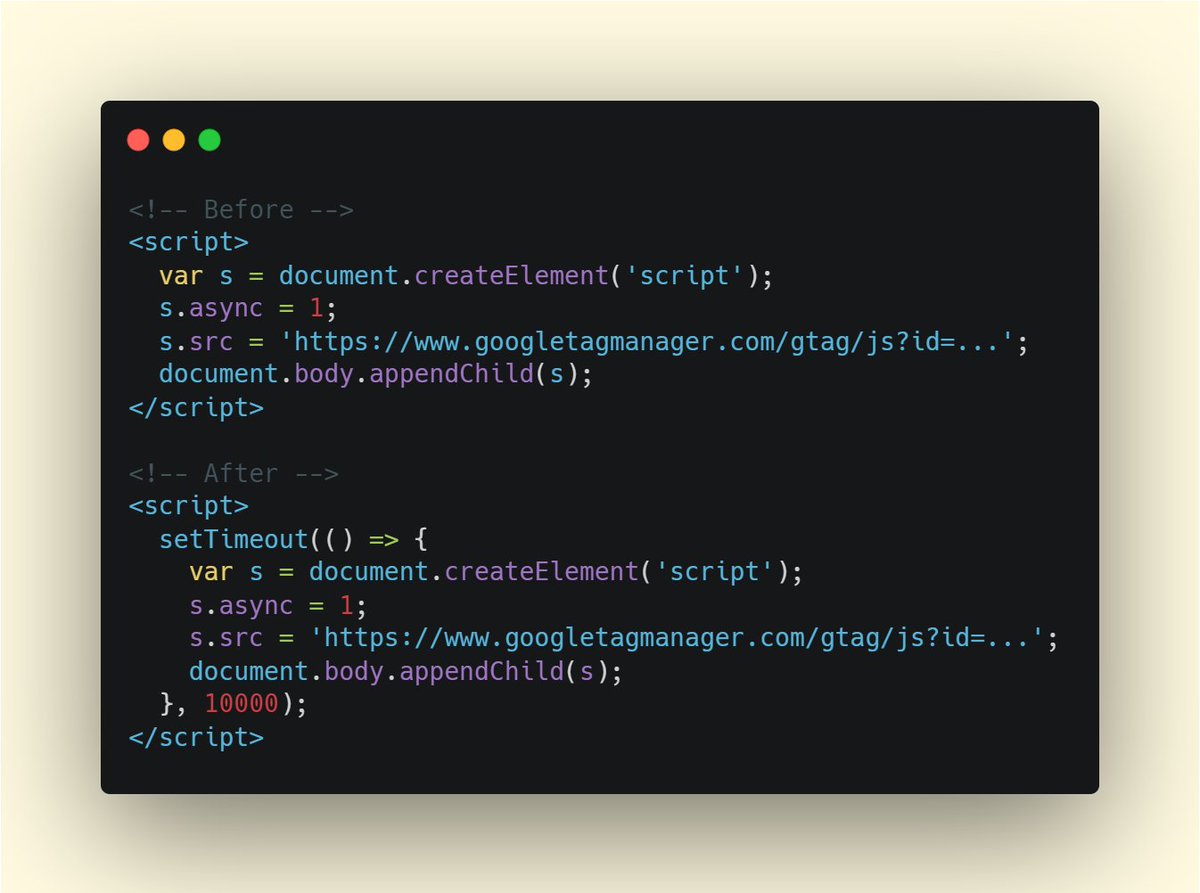
37) Defer your third-parties.
Google Analytics, Intercom, and other third party scripts steal bandwidth and CPU time from your app. E.g., here’s a great example: https://3perf.com/blog/notion/#defer-third-parties
To make sure they don’t affect your loading time, don’t load them till your app initializes:
Google Analytics, Intercom, and other third party scripts steal bandwidth and CPU time from your app. E.g., here’s a great example: https://3perf.com/blog/notion/#defer-third-parties
To make sure they don’t affect your loading time, don’t load them till your app initializes:
199 likes, halp, how do I come up with enough tips
39) Okay, let’s talk about tooling.
Almost everyone knows about Lighthouse. But not everyone knows that you can run Lighthouse from cli: https://www.npmjs.com/package/lighthouse
Useful if you need to automate some tests!
Almost everyone knows about Lighthouse. But not everyone knows that you can run Lighthouse from cli: https://www.npmjs.com/package/lighthouse
Useful if you need to automate some tests!
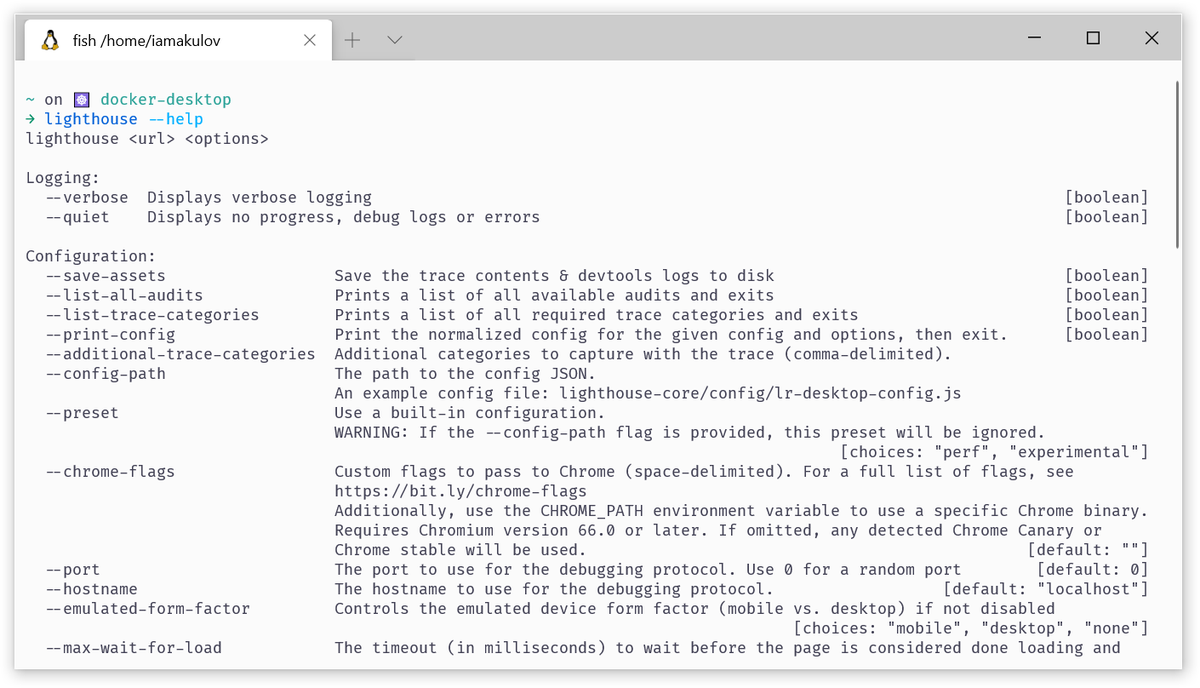
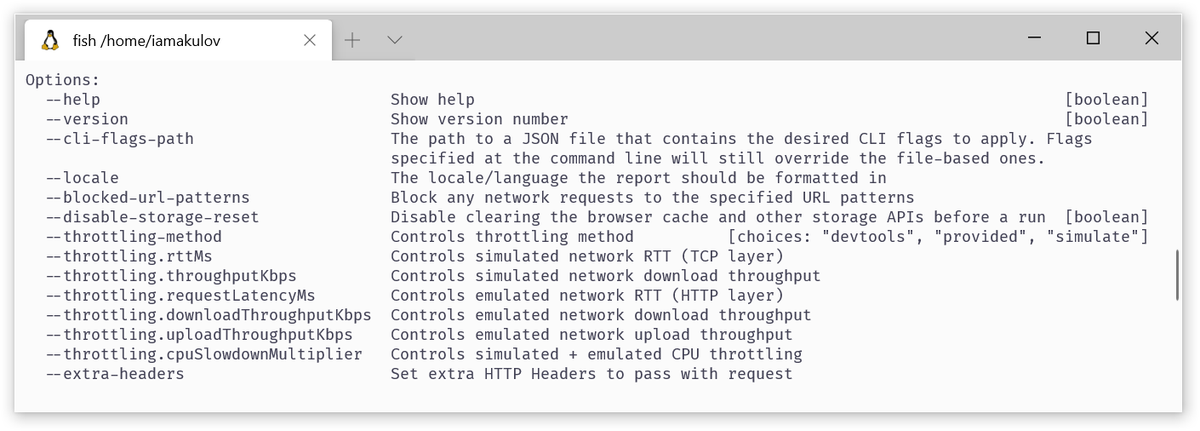
40) Lighthouse CLI also supports a bunch of advanced options not available in DevTools – like custom throttling settings, or extra HTTP headers:
41) Another great tool is WebPageTest: https://webpagetest.org/
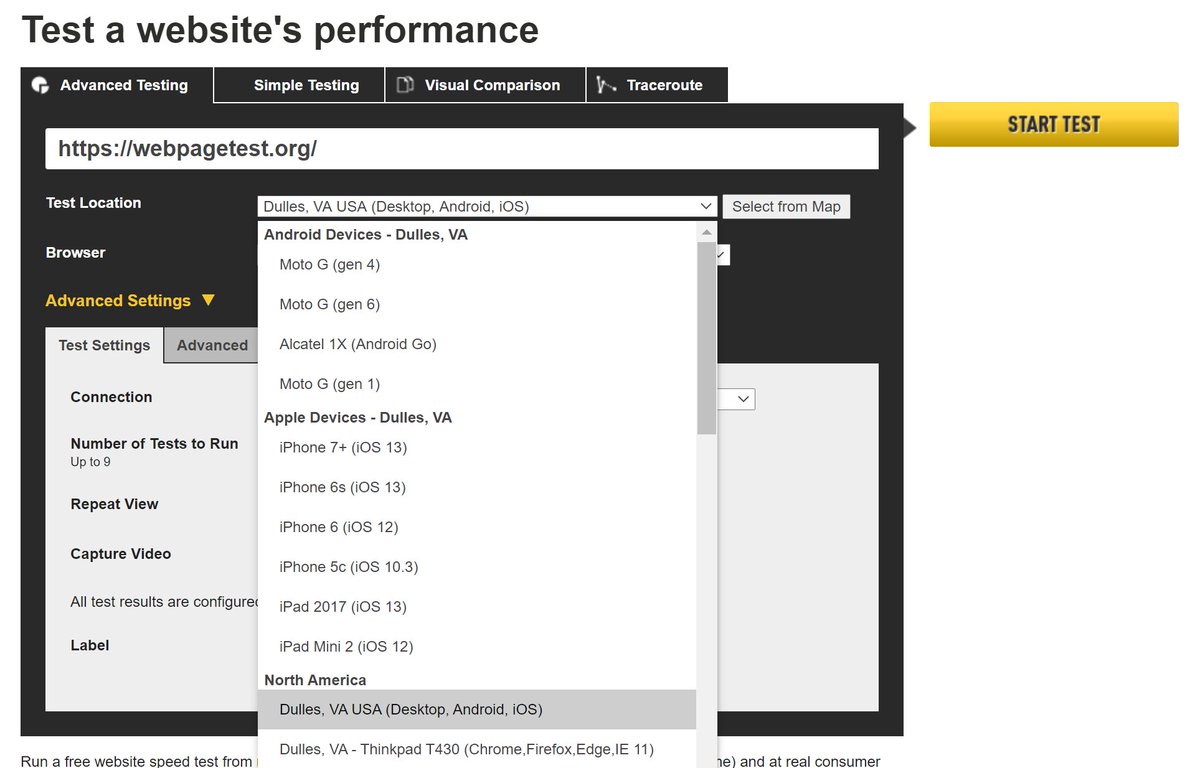
WebPageTest is the most advanced perf tool I know. It has a ton of use cases – but one of my favorites is testing perf from real devices and various locations.
iPhone 6 in the US? Yes. Firefox in India? Why not.
WebPageTest is the most advanced perf tool I know. It has a ton of use cases – but one of my favorites is testing perf from real devices and various locations.
iPhone 6 in the US? Yes. Firefox in India? Why not.
42) Webpack has a whole ecosystem of tools around it.
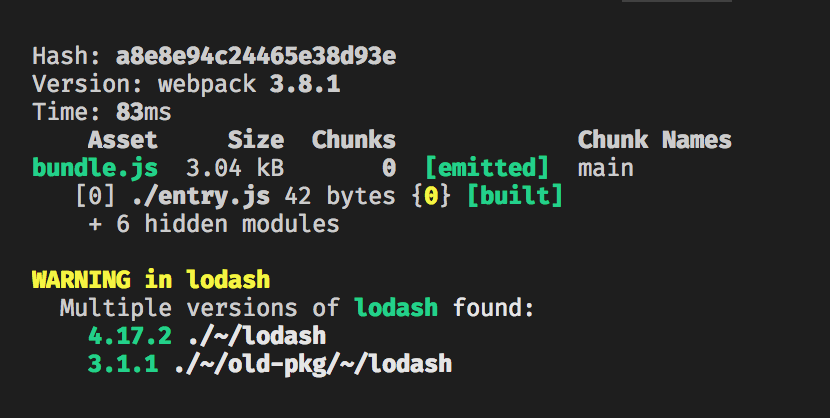
`duplicate-package-checker-webpack-plugin` warns if you have multiple versions of the same library bundled (which is super common with core-js):
https://www.npmjs.com/package/duplicate-package-checker-webpack-plugin
`duplicate-package-checker-webpack-plugin` warns if you have multiple versions of the same library bundled (which is super common with core-js):
https://www.npmjs.com/package/duplicate-package-checker-webpack-plugin
43) bundle-buddy shows which modules are duplicated across your chunks. Use it to fine-tune code splitting: https://www.npmjs.com/package/bundle-buddy
44) With http://webpack.github.io/analyse/ , you can figure out why a specific module is included into the bundle.
Useful if you see something large in the webpack-bundle-analyzer report, and you aren’t sure why it’s there. https://twitter.com/iamakulov/status/1262391889048764421
Useful if you see something large in the webpack-bundle-analyzer report, and you aren’t sure why it’s there. https://twitter.com/iamakulov/status/1262391889048764421
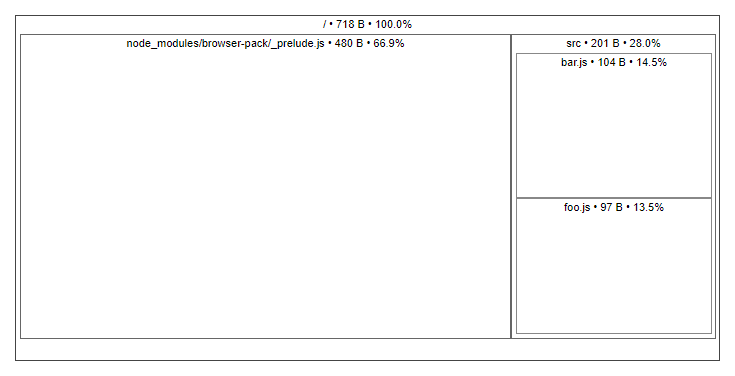
45) source-map-explorer build a map of modules and dependencies based on a source map: https://www.npmjs.com/package/source-map-explorer
Unlike webpack-bundle-analyzer, it only needs a source map to run. Useful if you can’t edit the webpack config (e.g. with create-react-app).
Unlike webpack-bundle-analyzer, it only needs a source map to run. Useful if you can’t edit the webpack config (e.g. with create-react-app).
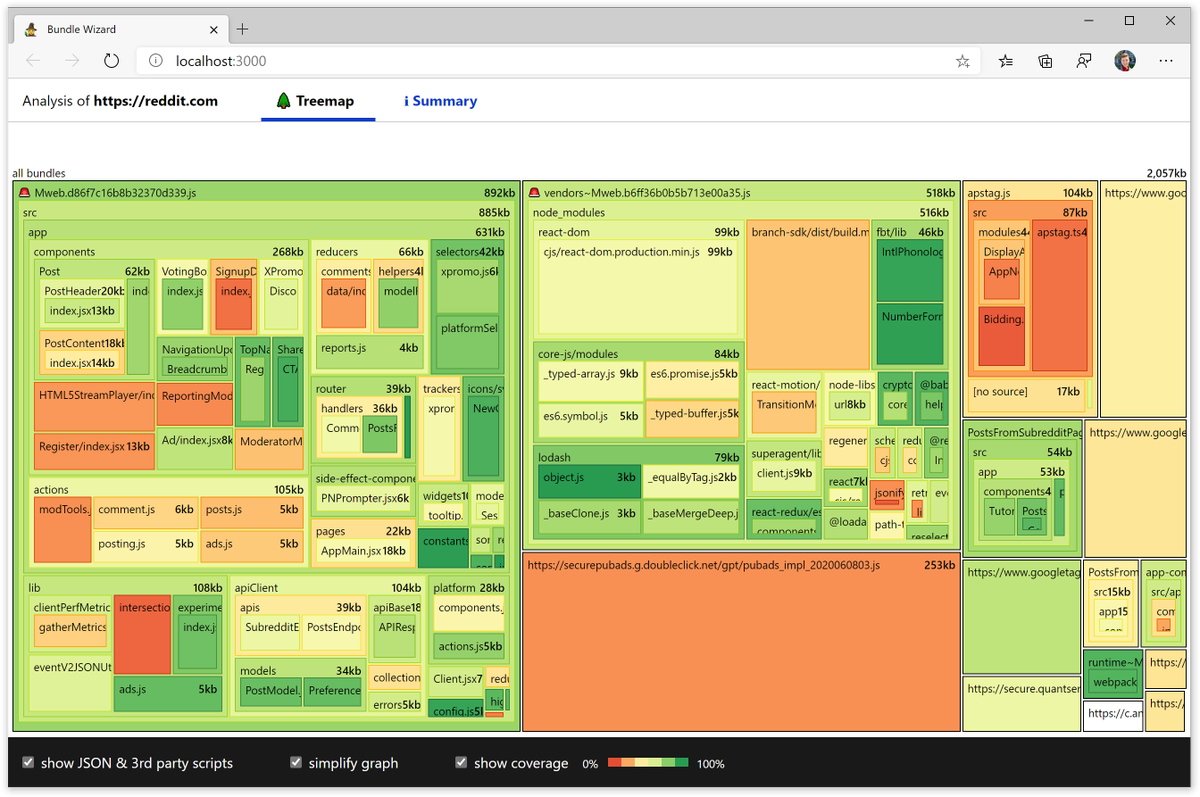
46) bundle-wizard also builds a map of dependencies – but for the whole page: https://www.npmjs.com/package/bundle-wizard
47) Okay, enough tools.
HTTP/2 is fast, in part, because it sends all assets over a single connection. But – sometimes that breaks.
E.g., if you misconfigure the crossorigin attribute, the browser would be forced to open a new connection.
HTTP/2 is fast, in part, because it sends all assets over a single connection. But – sometimes that breaks.
E.g., if you misconfigure the crossorigin attribute, the browser would be forced to open a new connection.
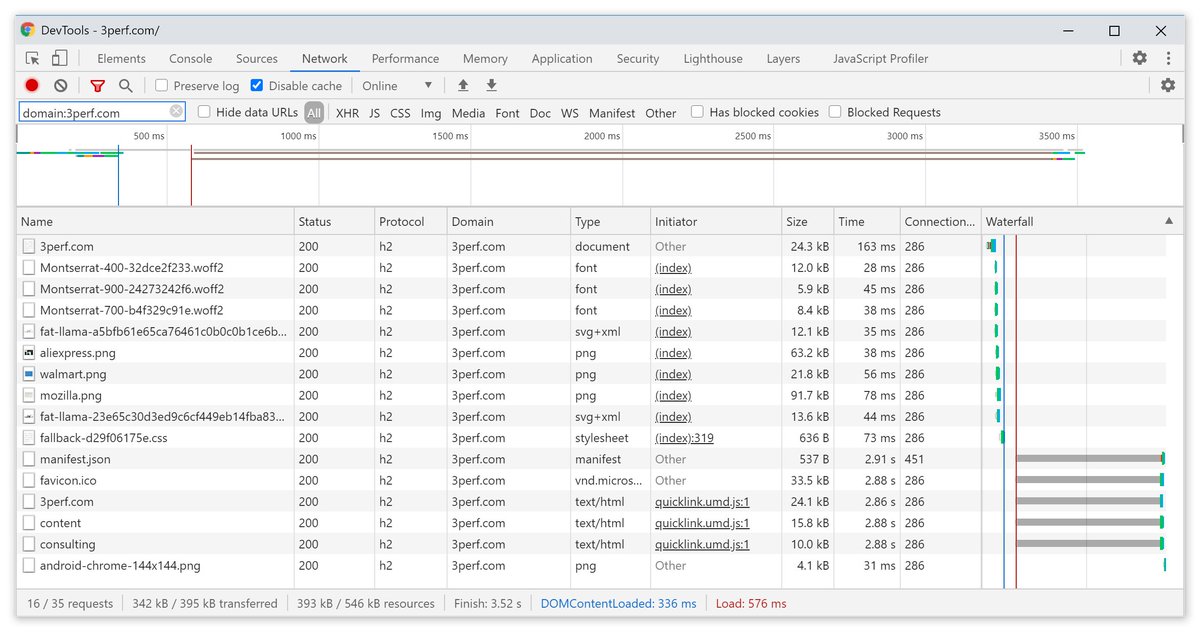
To check whether all requests use a single HTTP/2 connection, or something’s misconfigured, enable the "Connection ID" column in DevTools → Network.
E.g., here, all requests share the same connection (286) – except manifest.json, which opens a separate one (451):
E.g., here, all requests share the same connection (286) – except manifest.json, which opens a separate one (451):
48) Use http://polyfill.io to reduce the amount of polyfills you’re serving.
http://polyfill.io inspects the User-Agent header and serves polyfills targeted specifically at the browser. So modern Chrome users receive nothing, and IE 11 users get everything.
http://polyfill.io inspects the User-Agent header and serves polyfills targeted specifically at the browser. So modern Chrome users receive nothing, and IE 11 users get everything.
49) Or: if you use babel-preset-env and Core.js 3+, enable `useBuiltIns: "usage"`.
This will bundle polyfills that you’d actually use and need: https://babeljs.io/docs/en/babel-preset-env#usebuiltins-usage
This will bundle polyfills that you’d actually use and need: https://babeljs.io/docs/en/babel-preset-env#usebuiltins-usage
50) If you have any `scroll` or `touch*` listeners, make sure to pass `passive: true` to addEventListener.
This tells the browser you’re not planning to call event.preventDefault() inside, so it can optimize the way it handles these events.
https://developers.google.com/web/updates/2016/06/passive-event-listeners
This tells the browser you’re not planning to call event.preventDefault() inside, so it can optimize the way it handles these events.
https://developers.google.com/web/updates/2016/06/passive-event-listeners
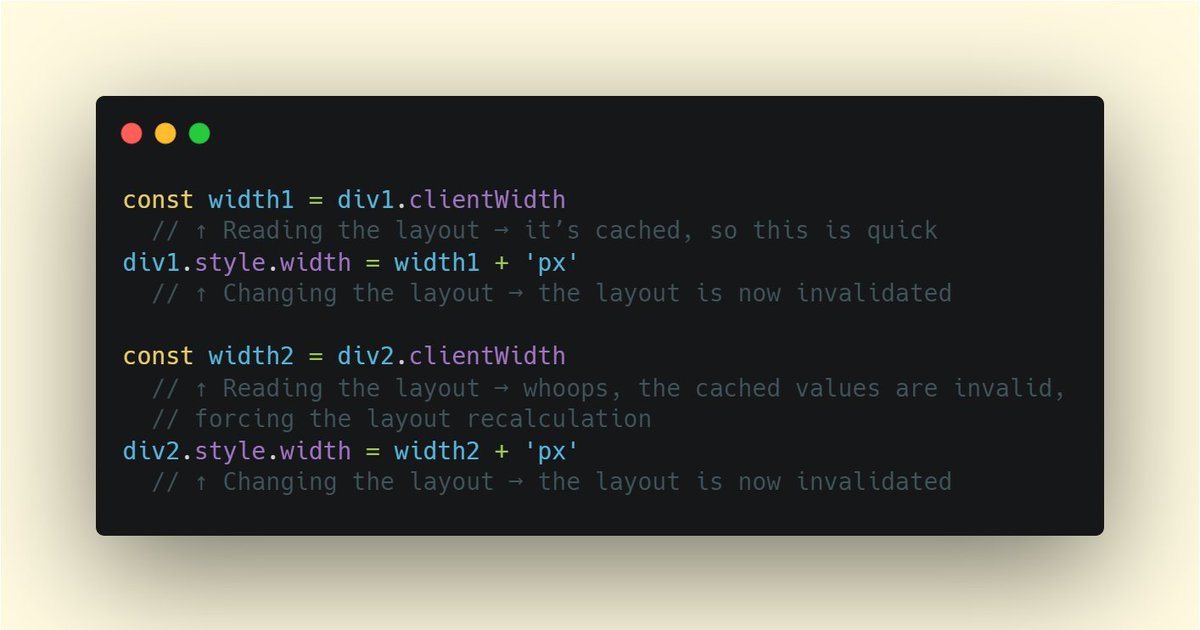
51) One common runtime perf issue is when the code reads and sets properties like `width` or `offset*` several times in a row.
The problem is, every time you change and then read a width or something, the browser has to recalculate the layout:
The problem is, every time you change and then read a width or something, the browser has to recalculate the layout:
And if you do this multiple times in a row, this easily gets slow.
Here’s the full list of properties that do this: https://gist.github.com/paulirish/5d52fb081b3570c81e3a
And here’s how to rewrite the code above so there’s no issue:
Here’s the full list of properties that do this: https://gist.github.com/paulirish/5d52fb081b3570c81e3a
And here’s how to rewrite the code above so there’s no issue:
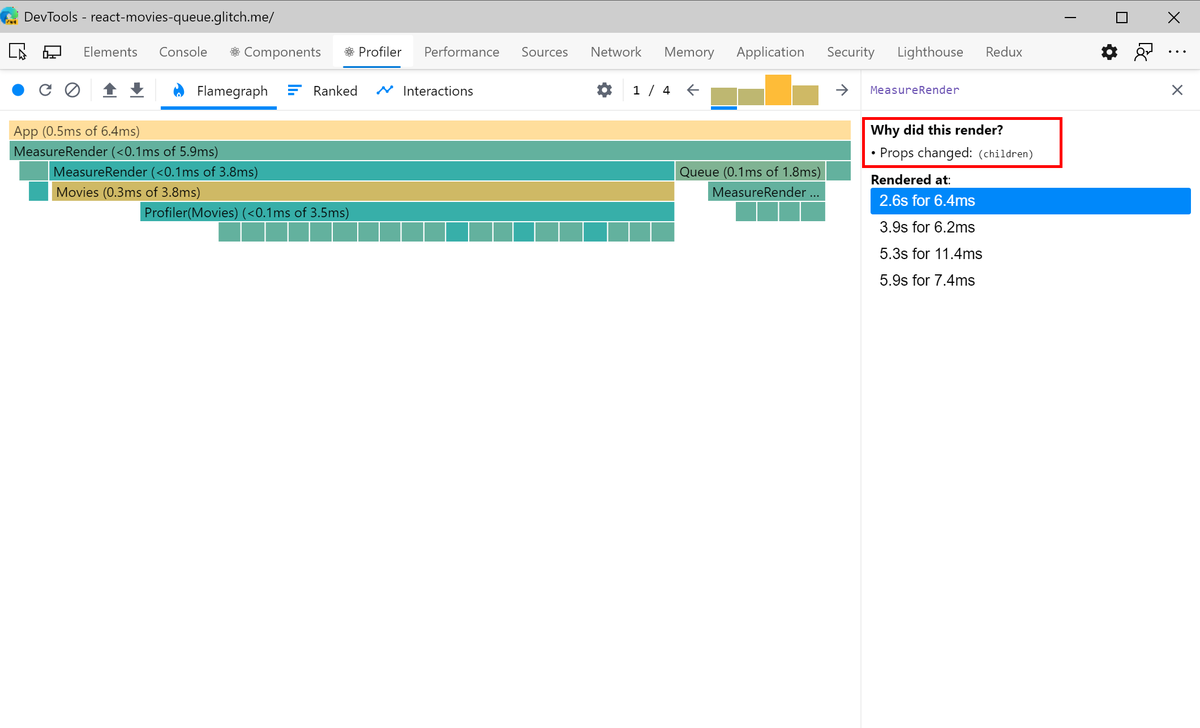
52) Debugging a React app? Not sure why a component gets rerendered?
1. Go to React DevTools → Profiler → Settings. Enable "Record why each component rendered"
2. Start the recording, do whatever you did, stop the recording
3. Click on the component in the perf trace
Voilà:
1. Go to React DevTools → Profiler → Settings. Enable "Record why each component rendered"
2. Start the recording, do whatever you did, stop the recording
3. Click on the component in the perf trace
Voilà:
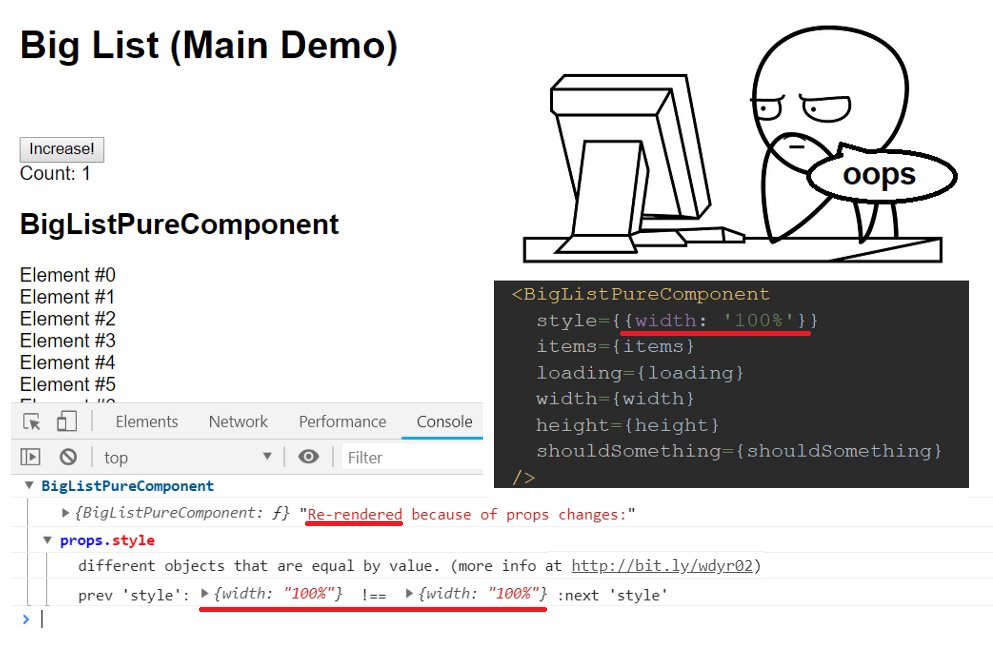
53) Debugging a React app? Not sure why a component gets rerendered?
Another way to figure out why a component re-renders is to use why-did-you-render: https://github.com/welldone-software/why-did-you-render
Demo pic from the docs:
Another way to figure out why a component re-renders is to use why-did-you-render: https://github.com/welldone-software/why-did-you-render
Demo pic from the docs:
54) Sometimes, you have a forced layout/style recalculation – but can’t remove it (eg because it’s caused by a third-party lib).
In this case, try limiting the scope of the recalc using `contain`:
.recaculated-elem { contain: content }
This can make the recalc much cheaper!
In this case, try limiting the scope of the recalc using `contain`:
.recaculated-elem { contain: content }
This can make the recalc much cheaper!
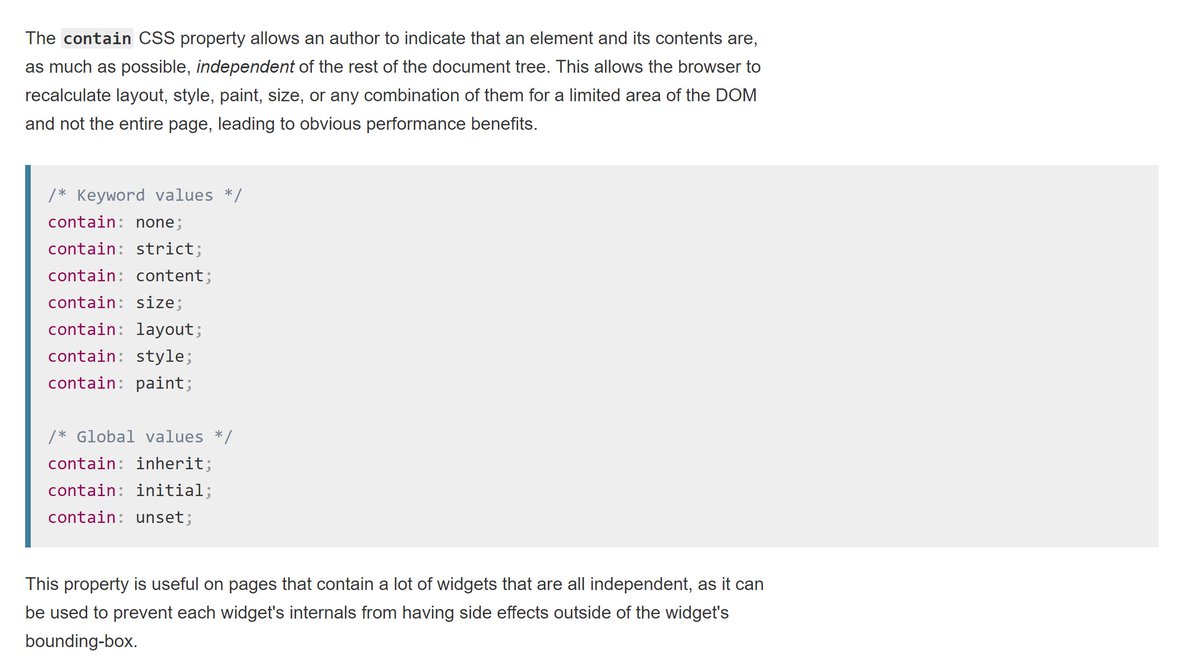
The `contain` CSS property tells the browser that the element is isolated from the surrounding document.
So if something changes inside the element, the browser could avoid recalculate just this element instead of the whole document.
https://developer.mozilla.org/en-US/docs/Web/CSS/contain
So if something changes inside the element, the browser could avoid recalculate just this element instead of the whole document.
https://developer.mozilla.org/en-US/docs/Web/CSS/contain

 Read on Twitter