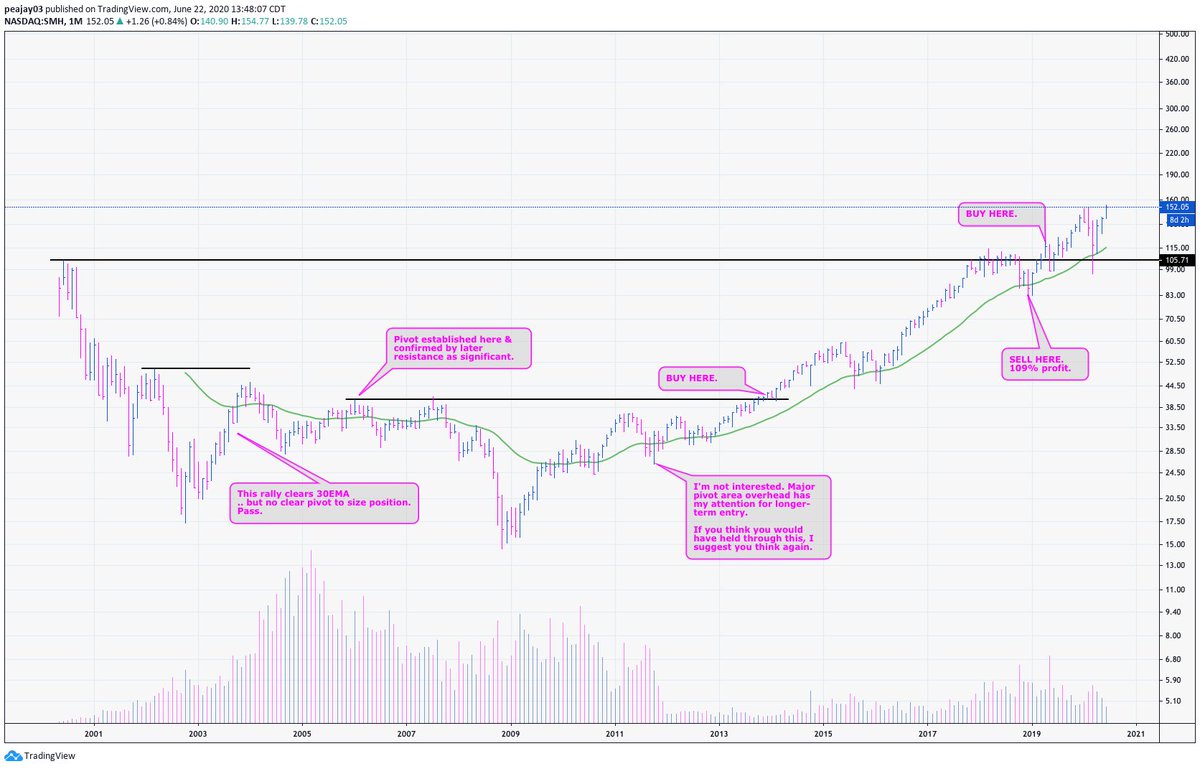
$SMH monthly chart, annotated for a strategy I employ.
This has been an evolving investment approach for me, but I'm increasingly finding I prefer the longer timeframe of monthly even to weekly trading. I'm likely to move most of my activity to this timeframe as a result.
This has been an evolving investment approach for me, but I'm increasingly finding I prefer the longer timeframe of monthly even to weekly trading. I'm likely to move most of my activity to this timeframe as a result.
As an aside, relative to $SMH itself: yes, I bought where shown and sold where shown.
Also, just something to think about: semis just recently broke to all-time highs from a huge base. Anything is possible, esp near term, but on a monthly chart? Patience will win out.
Also, just something to think about: semis just recently broke to all-time highs from a huge base. Anything is possible, esp near term, but on a monthly chart? Patience will win out.
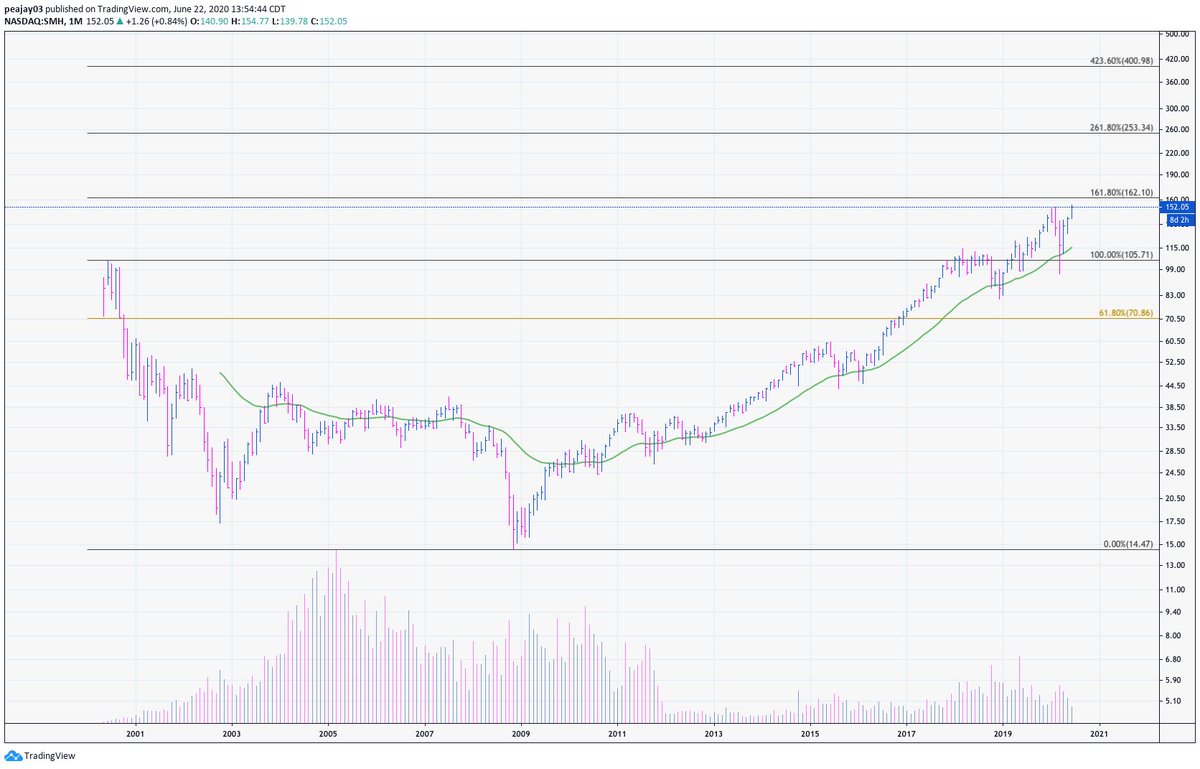
Mentioned in tweets past that I often like to use fibs for intermediate profit-taking targets once in blue sky territory. Applies to monthly charts, too.
Throwing them on $SMH, we're giving the 161.8 extension a look-see soon. From there a move above would have me thinking 250+
Throwing them on $SMH, we're giving the 161.8 extension a look-see soon. From there a move above would have me thinking 250+
So, I'll still use my weekly strategy that I've written here before. But far more sparingly. Most of my work going forward is shifting to a monthly approach -- less activity, more sitting. Less worrying about someone's near-term indicator, more simply watching price on a chart.
My goal has been to move towards active management and away from "trading," meaning if I can hold something for a year or much more -- I want to be able to do that. That's where real $$ is made.
Buy right, hold long. Honor thy stops and be patient. If I had to sum it up.
Buy right, hold long. Honor thy stops and be patient. If I had to sum it up.
One other comment. I am very very very much a Stan Weinstein guy in terms of how I interpret charts. Stan was a pioneer in weekly; what I've tried to do is build a process that takes the tenets of his appoach, and applies them to a monthly process.
I think I've done that.
I think I've done that.


 Read on Twitter


