US Update: 6/21/2020 (Data from yesterday)
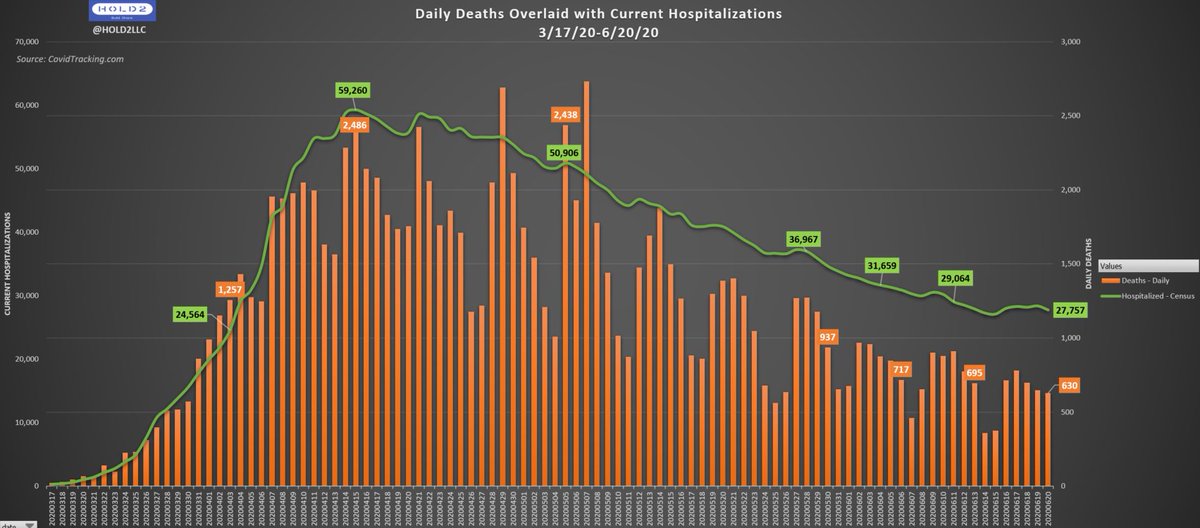
Graph 1: Daily Deaths Overlaid with Current Hospitalizations
Lowest Saturday-reported deaths so far. Last 4 marked for comparison
Hosps back down - basically flat the last since 6/13 (7 days)
/1
Graph 1: Daily Deaths Overlaid with Current Hospitalizations
Lowest Saturday-reported deaths so far. Last 4 marked for comparison
Hosps back down - basically flat the last since 6/13 (7 days)
/1
Graph 2: Daily Hospitalizations vs. Deaths (7-Day Avg) vs. Daily Detected Cases
- Another large increase in cases
- 7-Day Death Avg drops further. Consistent drop all week with no hump
- Hospitalizations flat for 7 days
/2
- Another large increase in cases
- 7-Day Death Avg drops further. Consistent drop all week with no hump
- Hospitalizations flat for 7 days
/2
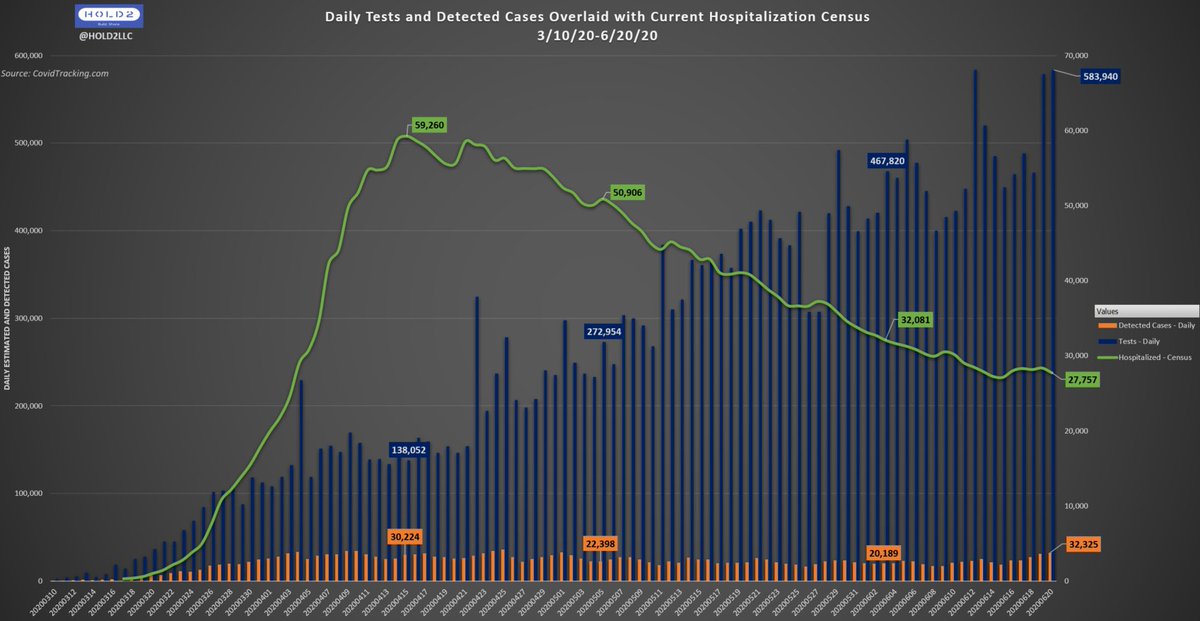
Graph 3: Daily Tests and Detected Cases Overlaid with Current Hospitalization Census
- Sizable increase in Cases and big jump in Tests
- 1-day Case Positivity same (5.5%)
- Tests jumped up but still doesn't seem like all of them
- Small drop in hospitalizations
/3
- Sizable increase in Cases and big jump in Tests
- 1-day Case Positivity same (5.5%)
- Tests jumped up but still doesn't seem like all of them
- Small drop in hospitalizations
/3

 Read on Twitter


