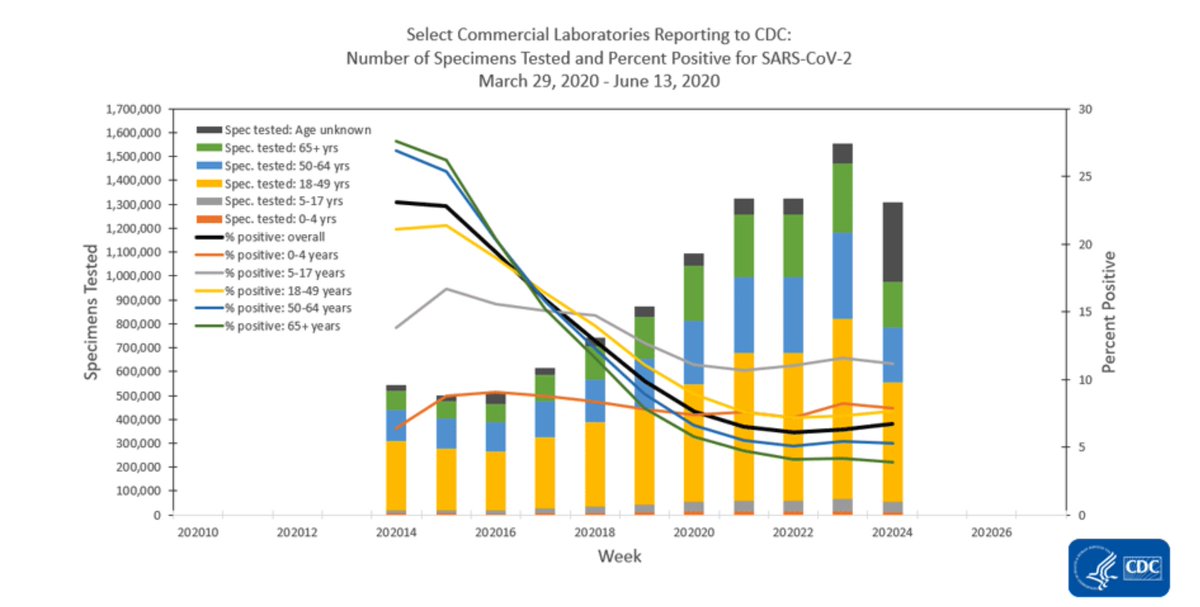
1/25 This week’s Covid-View tells the story of many epidemics. Trends are diverging within the US and globally. What will places do about travel from areas with lots of spread? Details matter, and this week’s data is particularly complicated. https://bit.ly/30Fj11C
2/25 @CDCgov publicly available data doesn’t provide the kind of granularity needed to look at states, but they did provide the code to the great folks at http://www.exitstrategy.org so I use their data to look at states.
3/25 The proportion of tests positive continued to increase slightly for the second week in a
row. Increases were driven by northeast, southeast, south central, central, and pacific northwest.
row. Increases were driven by northeast, southeast, south central, central, and pacific northwest.
4/25 Positivity in children continued to increase. Are any communities offering appealing, safe, voluntary housing to infected people so we can protect families and curtail transmission? Other countries do this routinely. We should. https://wapo.st/3ehn7Rv
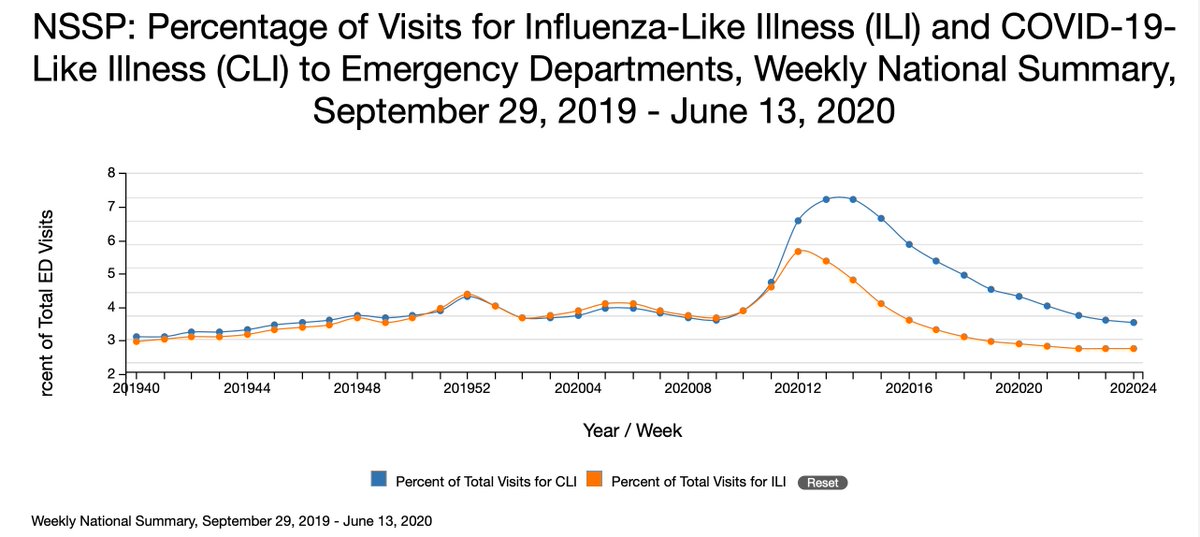
5/25 Influenza- and Covid-like illness (ILI and CLI) visits as a percent of all visits continued to fall, but there were slight increases in the proportion of CLI visits in South Central and West Coast, likely representing increased spread.
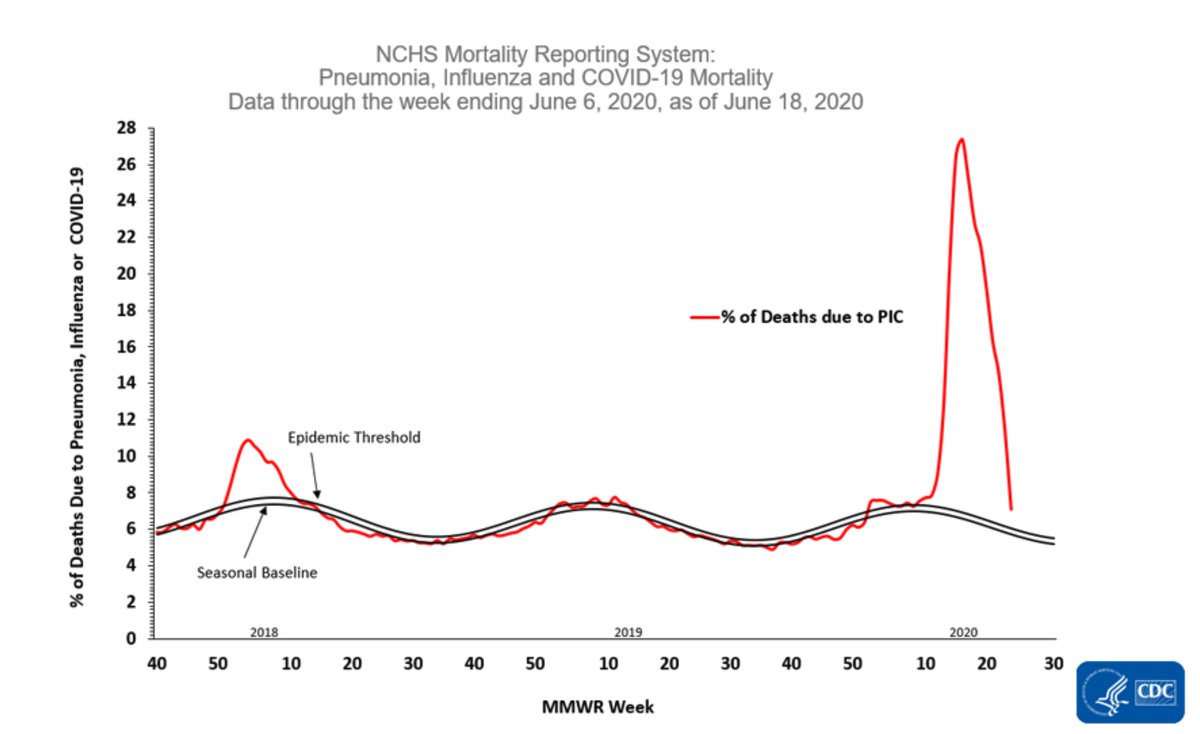
6/25 Deaths continue to decline steadily-so far-and are close to baseline. Baseline could still mean hundreds of people a day dying from #COVID19. Have we become inured to this? Usually, a few deaths from a preventable infectious disease causes appropriate, intense concern.
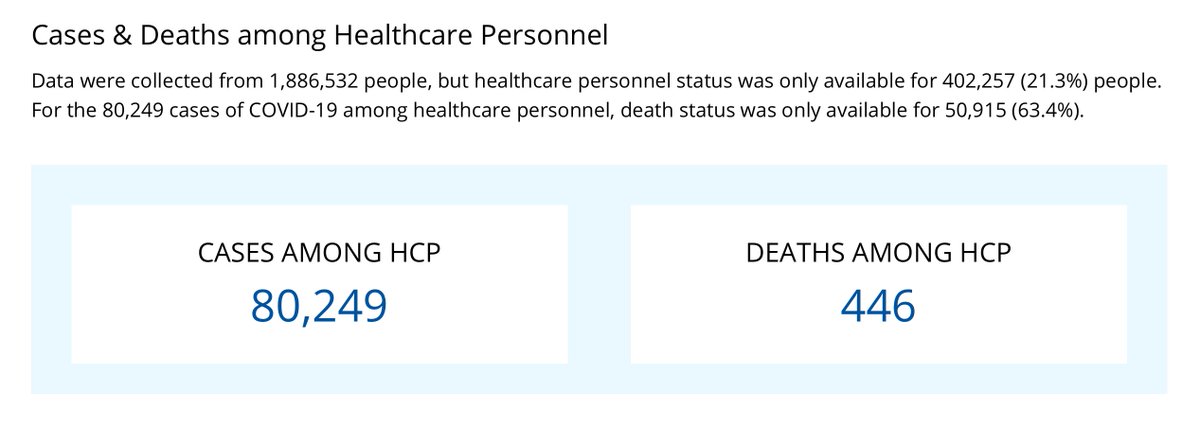
7/25 Another part of the CDC website has total health care worker cases and deaths. Shocking, unacceptable. We MUST make health care workers and health care safer. Are we inured to this also? When ONE health care worker died from tuberculosis, there was justifiable outrage.
8/25 Thanks to the Washington Post for this moving tribute to some of those who have died caring for others. It should be a must-read for those who set policy and budgets. https://wapo.st/2NbXeHa
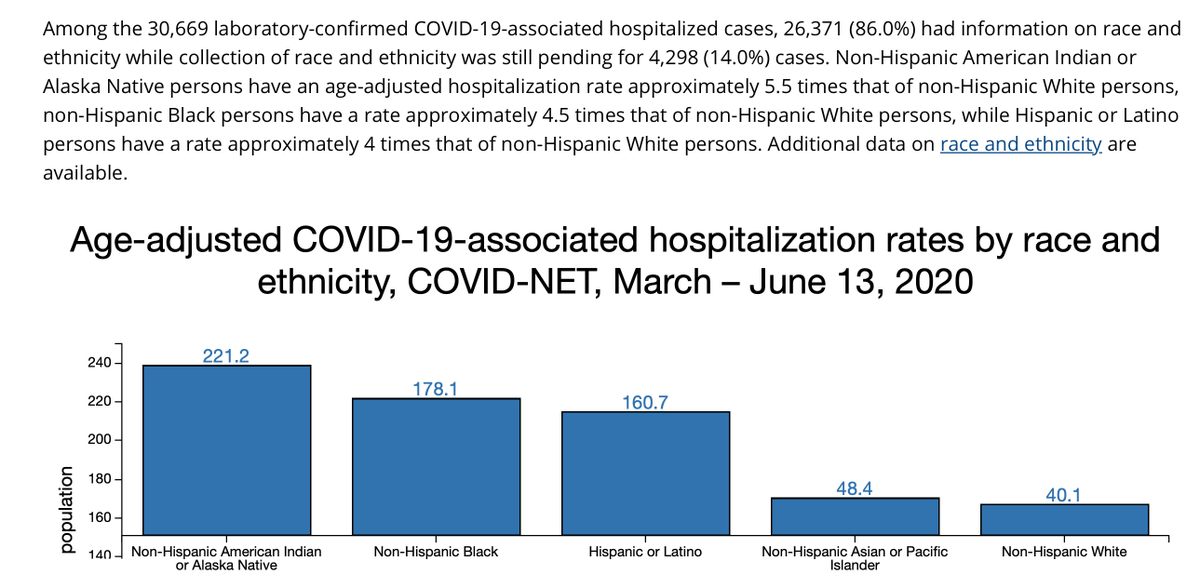
9/25 Unacceptable disparities continue. Are there any communities in the US that have avoided these inequalities? Exposure, underlying health, access to health care. Each must be addressed.
10/25 CDC has some state- and county-specific data, but there are better sources, unfortunately. Let’s do a deep dive looking at states, starting with http://www.covidexitstrategy.org . Look at both their tabs but the CDC Beta is better for trends.
11/25 Only 8 states are green, and most are red. The most reassuring trends are in NY, NJ, VT, CT, DE, NM, IL, WI. All have stable or increasing testing, decreasing test positivity, and decreasing cases. Keep it up (and trace every case)!
12/25 Here’s another good site. Note that positives are increasing more than testing, consistent with positivity increasing and showing that there is increased spread of the virus. https://tabsoft.co/30ZdNhy
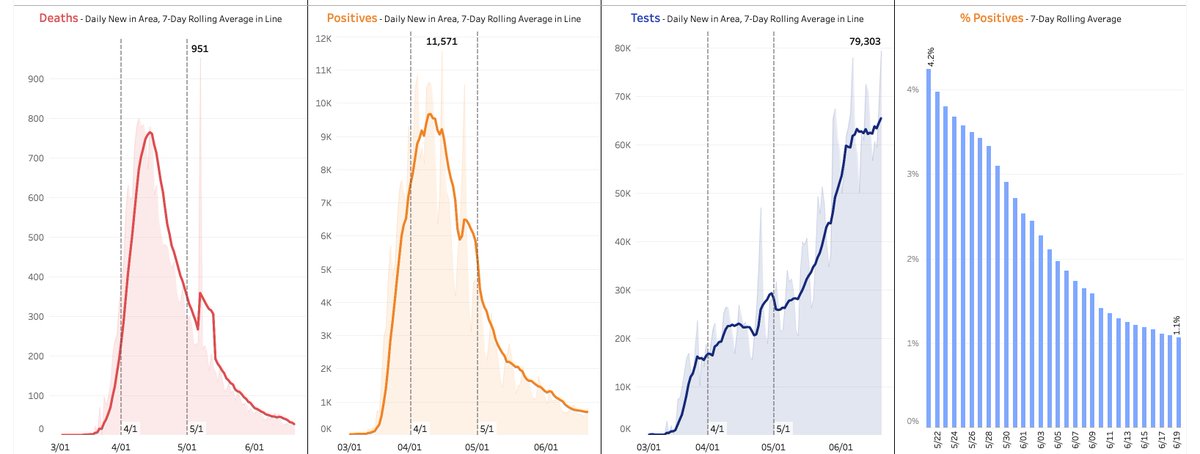
13/25 Here’s NYS. Steady progress. Case curve looks like a ski-jump, not a bell curve. Why the slower decline than increase? Much of the increase was missed because of lack of testing, testing increased as cases decreased, and continued spread during the decrease.
14//25 Most concerning states? Large and increasing numbers of cases, increasing test positivity rates: AL, AZ, FL, SC, TX. Also worrisome: CA, GA, LA, NC, NV, OK, OR, UT. (AK increasing testing a lot so not on list, some others e.g. WY, ID increasing but low numbers.)
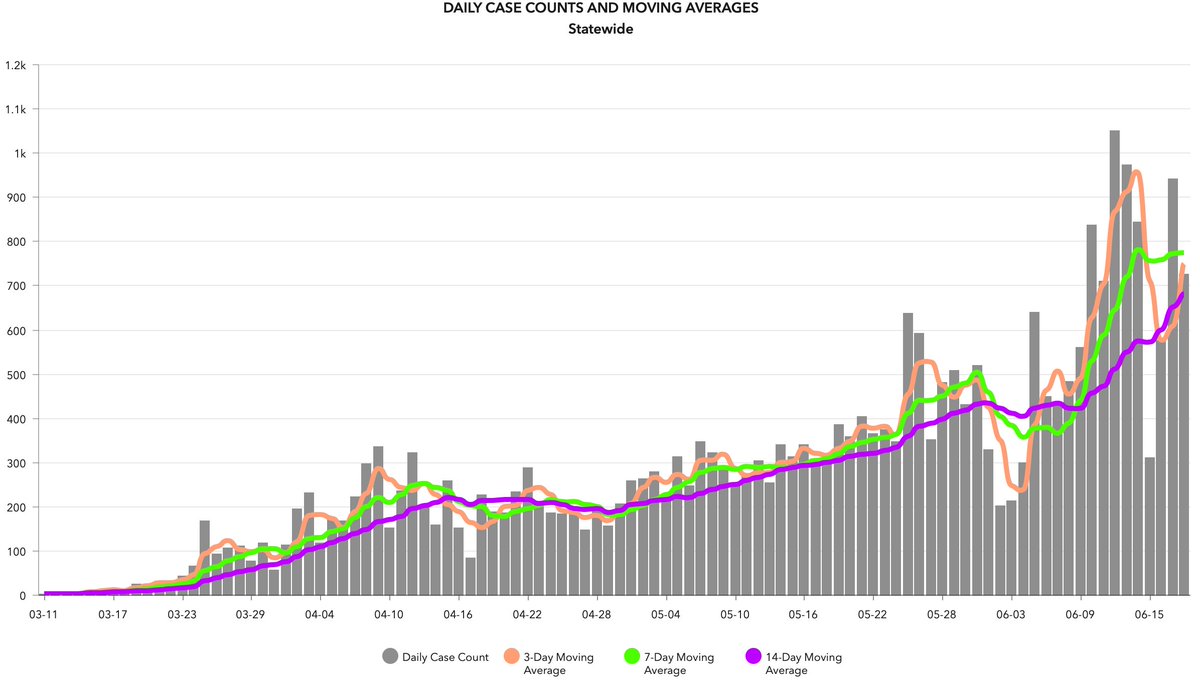
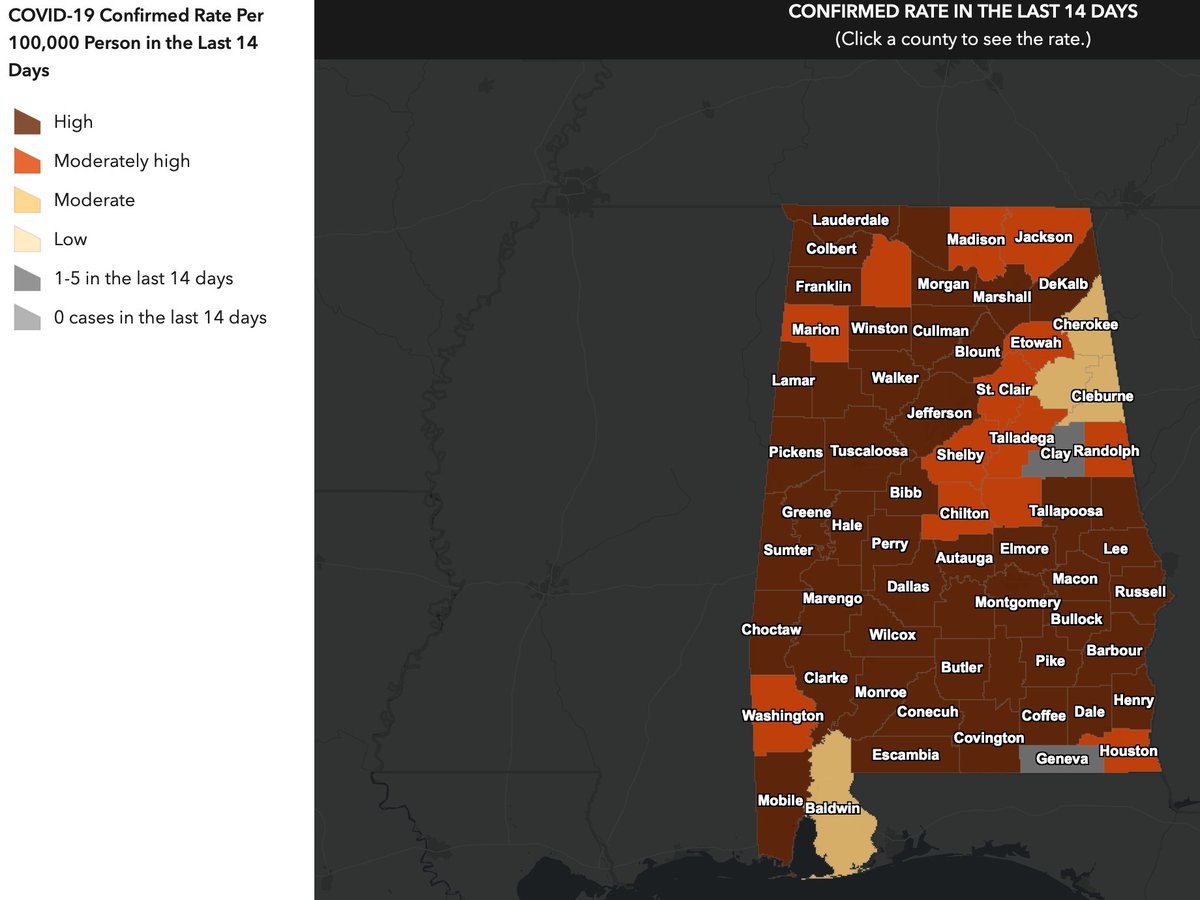
15/25 Let’s look at the big 5 in the most trouble. Start with home sweet Alabama. Here’s their website with graph of hospitalizations no state would like to see. Hospitalizations lag spread by ~two weeks, so expect at least another 2 weeks of increases. https://bit.ly/2BpuGXI
18/25 We reviewed Arizona last week. Excellent state dashboard for epi data, tho wish it had contact tracing indicators. ED visits, cases, hospitalization, ICU, ventilator beds all up. How high will it go? https://bit.ly/2Ygn02Z
19/25 Florida. Test positivity rate more than tripled, from 3% to 10%, and cases are spiking. People were asking why cases weren’t increasing in Florida. It was just a matter of time.
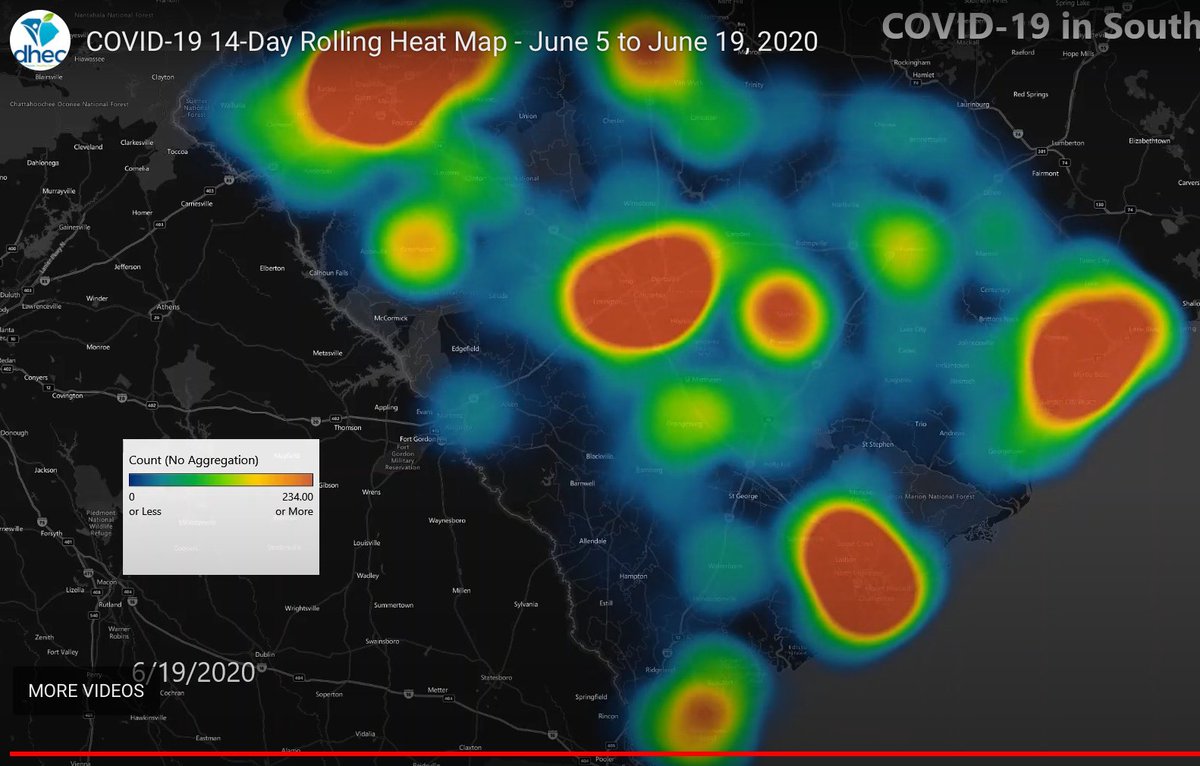
20/25 South Carolina. Nice data visualization on the state’s website, but the implications are frightening. Watch this 9-second YouTube clip:
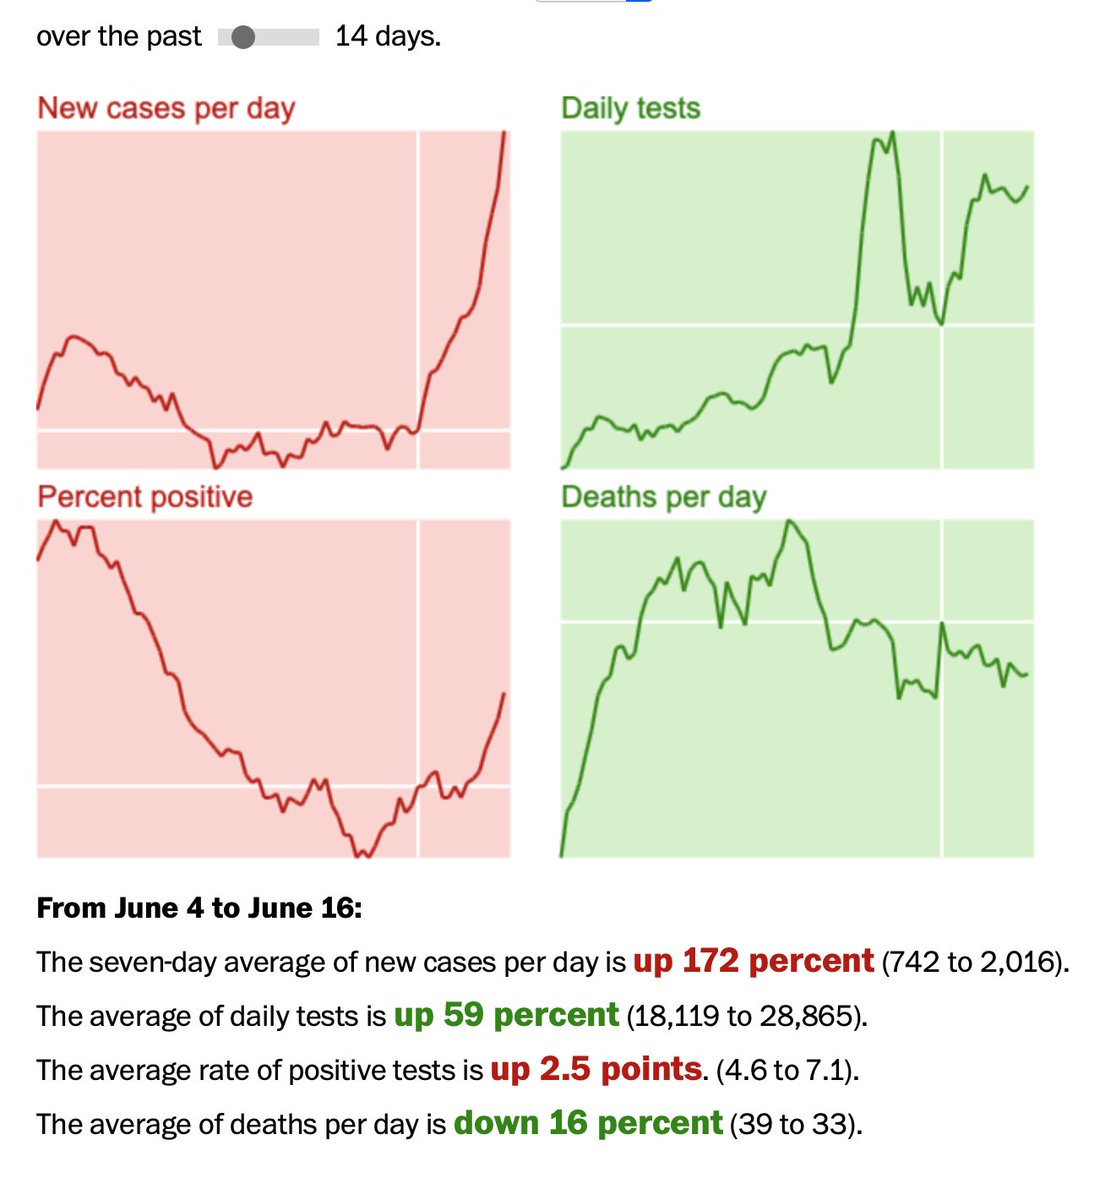
21/25 Finally, Texas. Covid is messing with Texas. Cases up. Test positivity up from 5.7% to 10.7%. Yes testing increased by a third, but cases much faster. Increasing positivity rate with increasing cases → they’re having a big increase.
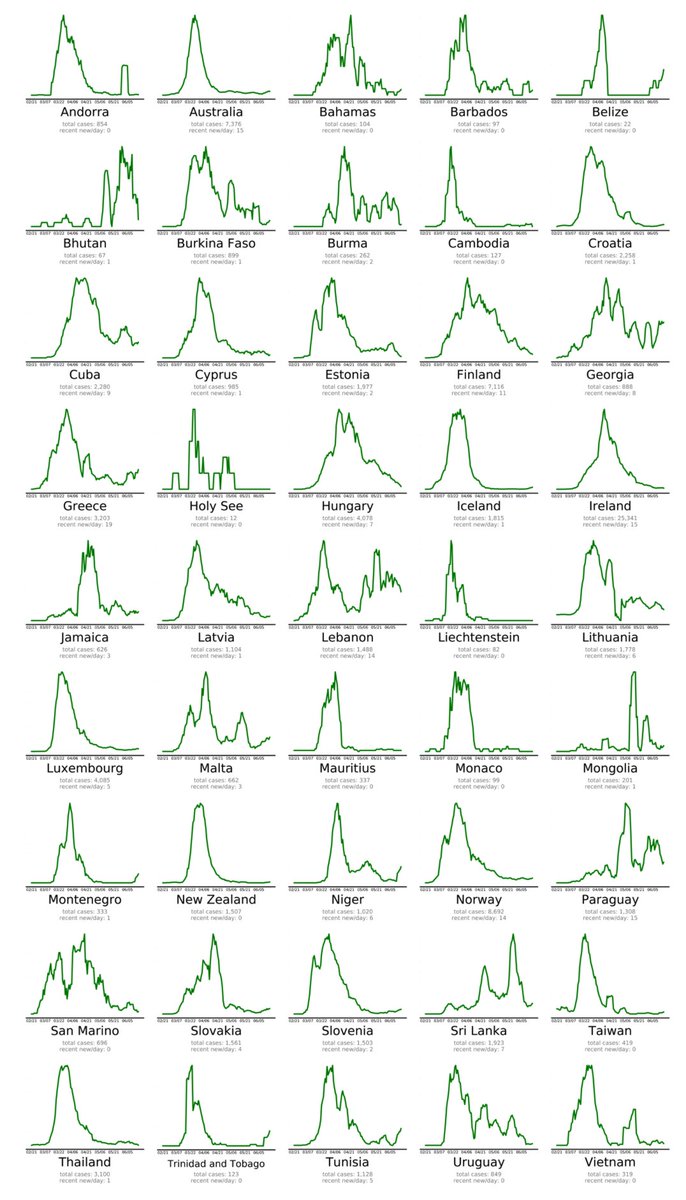
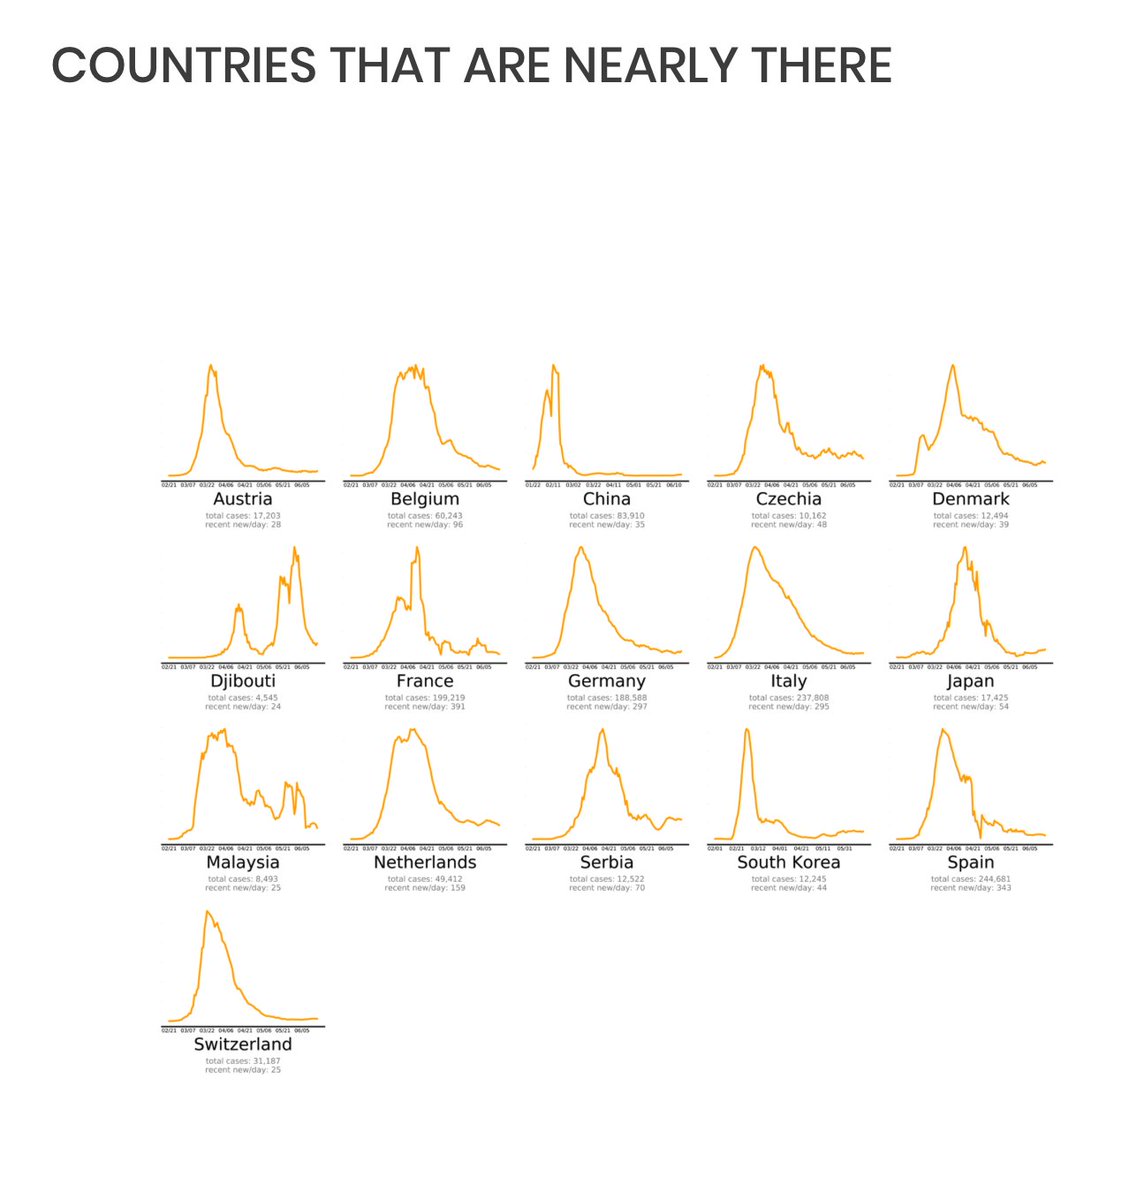
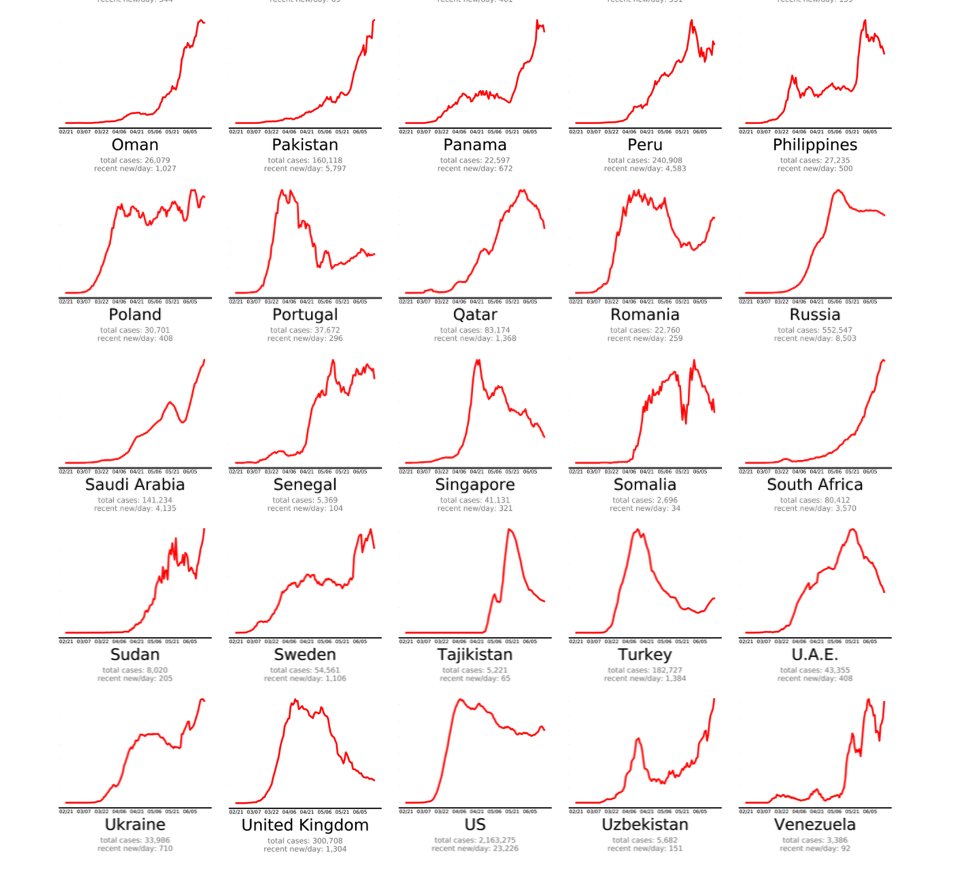
22/25 How do we match up globally? Poorly. Many countries stopping Covid, some making progress, just starting to hit Latin American-hard-then there are the laggards, like the US. Here’s an interesting site: https://www.endcoronavirus.org/countries
Not all will hold, but trends encouraging here:
Not all will hold, but trends encouraging here:
25/25 Big picture in US: Where we stayed physically distant, cases decreasing but need to ramp up contact tracing to prevent resurgence with increased activity. Where distancing stopped too soon, big rebounds have just begun. Another 20,000 deaths in the next month, at least.

 Read on Twitter