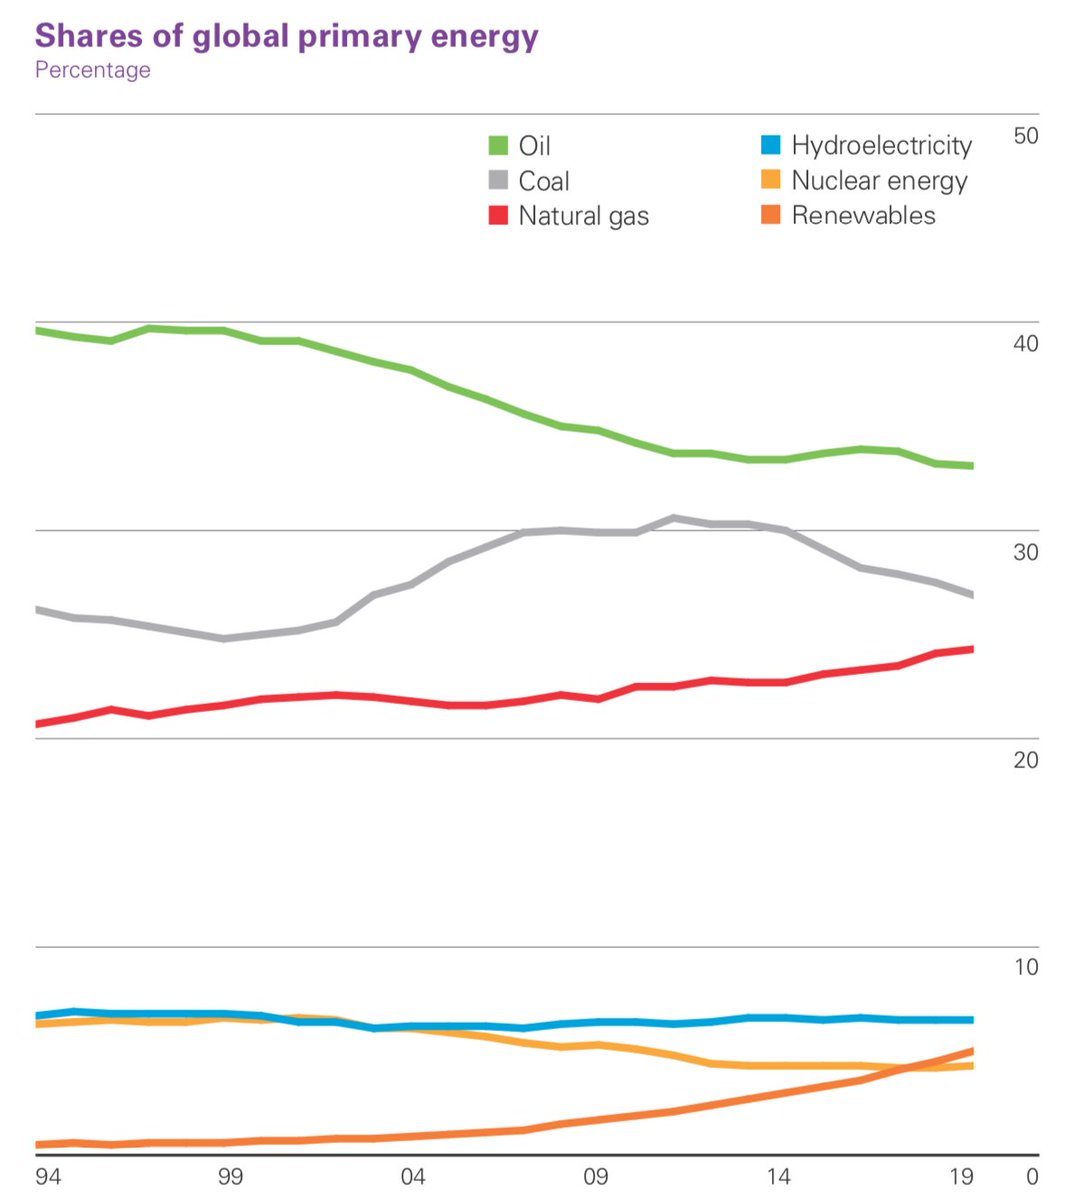
We are all busy, so will compress the new BP review of world energy into three key charts. Here is No1 - primary energy demand up 1.3% (below 10yr trend): renewables (wind/solar) met the magic 5% mark, ahead of nuclear for the first time, and growing at 24% (solar) and 13% (wind)
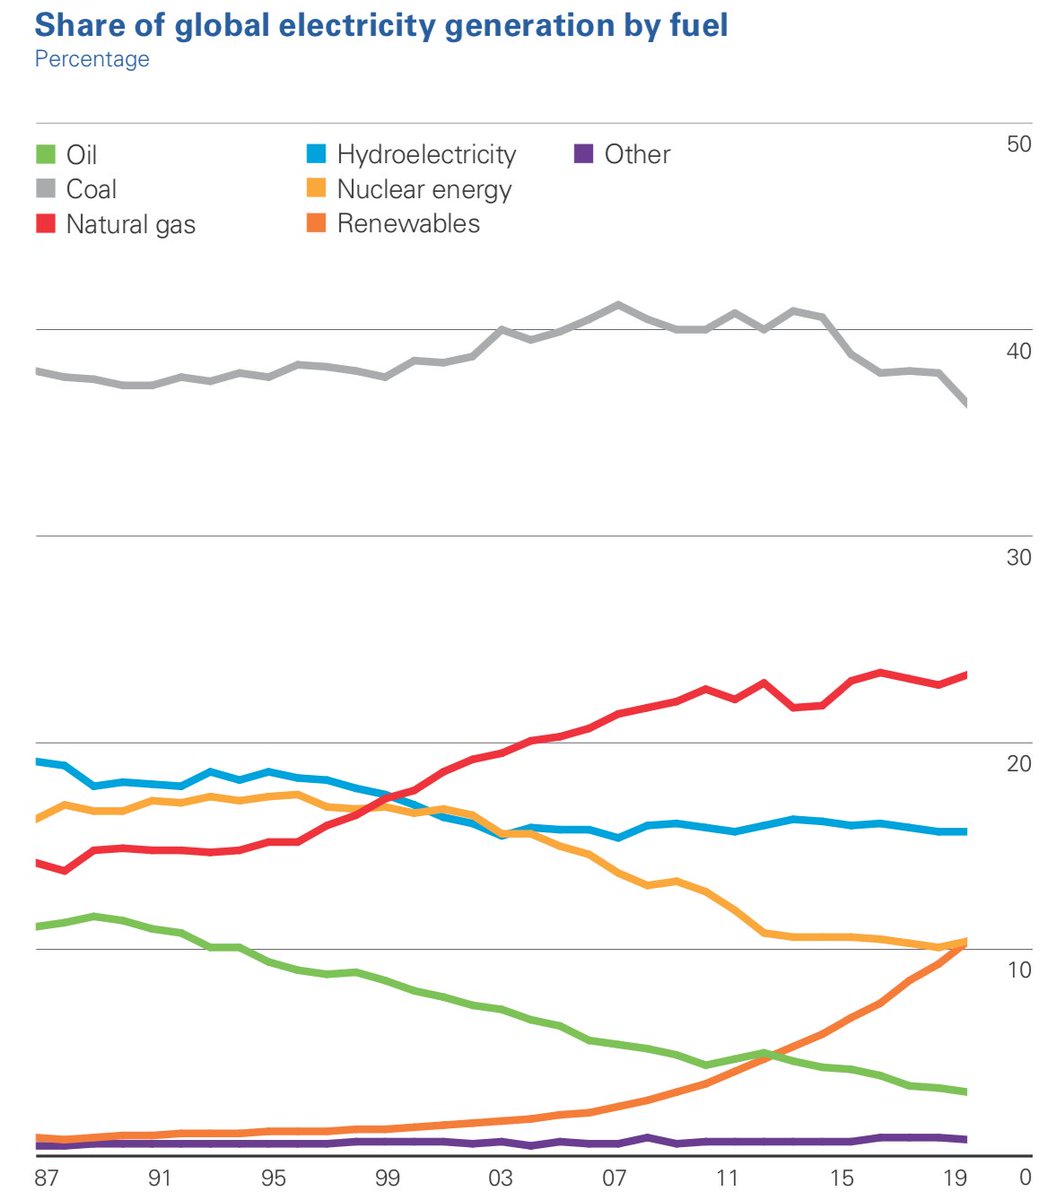
Note also how the big three fossil fuels are declining or flat-lining: this is most striking in global electricity demand: wind / solar now up to > 10% of total, overtaking nuclear and will overtake hydro 2022:
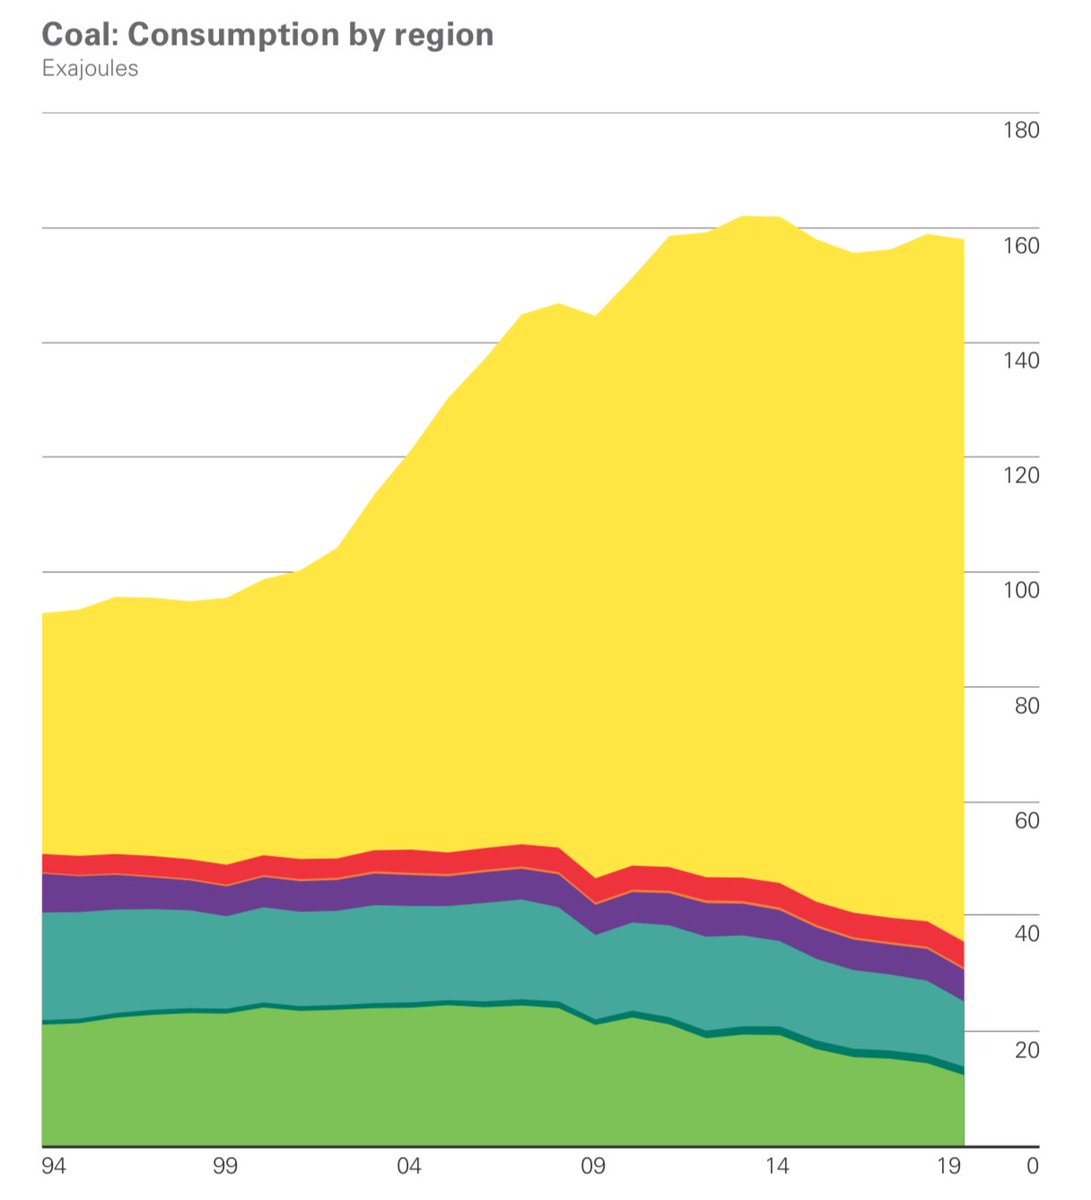
Finally chart wise is the persistency of coal in Asia: this chart shows that the demise of coal, starting in 2013 is well underway everywhere but Asia Pacific . There are lingering issues in the EU, but Asia is where the battle for coal removal sits.
Finally - some other key facts: oil demand only grew at 0.9% or ca 0.9 mb/d, 30% below 10yr trend of 1.3%, hence OPEC cuts. Gas increase of 2% also below long trend of 2.5%. We can assume they will be negative in 2020.
And one last point -many of the tables are in exajoules this time. No more million tonnes (1EJ=24Mtoe). Handy note is a single joule is the energy required to lift your iPhone to your ear or lift a glass of wine to your lips. World consumed 584 billion billion joules - cheers !

 Read on Twitter


