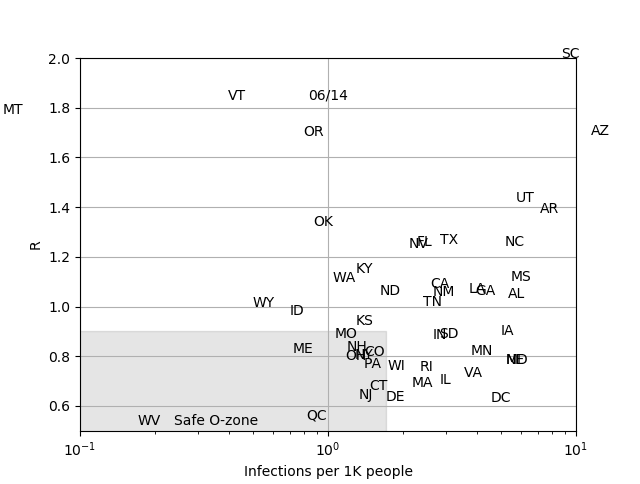
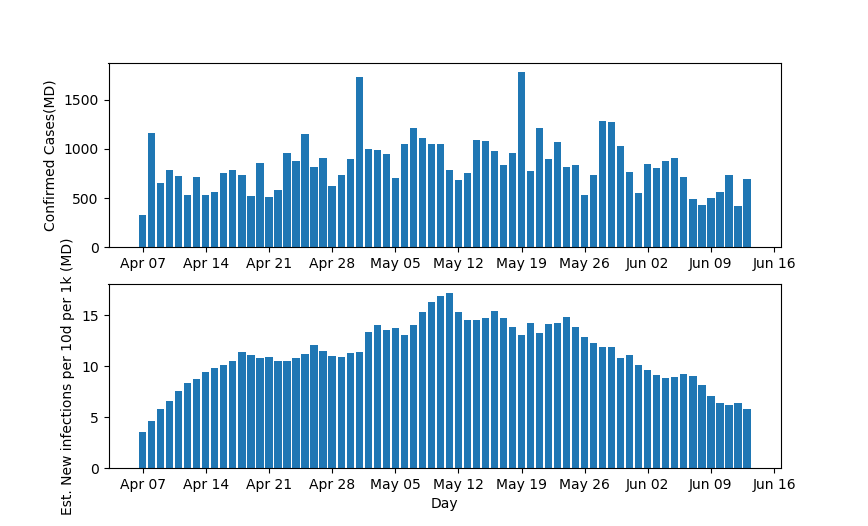
OK, every so often, for new followers, a methods thread. This will be good for ppl who like statistics, I hope. I make these plots showing R and infection density. To make them, my data first comes from @COVID19Tracking . The listed data is cum. positives, and cumulative tests 1/
I clean this data a little, because the states do data dumps that don't represent ongoing infections. Then, I calculate the number of positives in the prior 10 days, and the number of tests. I use these two sums to calculate the 10 day test positivity, which ranges 0-1. 2/
@ellis2013nz has a nice blog post explaining how to use confirmed cases and test positivity to estimate actual infections. I follow his methods. I did my own backtesting to confirm them. And, I normalized the constant by antibody prevalence data. My formula is 3/
Actual infections = 19.6 * Confirmed Cases * sqrt (positivity) 4/
For example, 100 positives with a test positivity of 25% gives 980 actual infections. Then, I divide actual infections by the population of the area in thousands, to get an infection density. And these are useful. 5/
They estimate, directly, how many people became infected in the prior 10 days per thousand. You can relate that to risk, directly. R is the ratio of infection density today, and two weeks ago, pro-rated to a 5.2 day period. Epidemiological use of R is evaluated on 6/
the reproductive cycle of the virus, which is 5.2 days for COVID19. From these, we can do fun things. For example, we can see what the infection density was in New Jersey at peak, and compare directly to today. 7/
And these plots help us understand where Arizona and South Carolina will now stand. As always, feedback is welcome, it is a gift, and anyone who wants source code (in python) email dblake AT augusta DOT edu. You can use it for whatever you like. 9/
My background. I am a PhD Biomedical Engineer (JHU) who studies brain physiology. My academic training leaned very heavily in statistics and signal processing, and I took the first year of medical school at Hopkins with the med students. 10/
The point of these social media posts is mainly to inform people about risks and trends in their areas. I also like to point out public health approaches to COVID19, but I am careful to stay in register with professional public health experts and epidemiologists. 11/
They are the experts. What I create could properly be called data science, and I am cool with that. And, btw, MOST medical doctors are NOT well trained in public health and epidemiology. If you see them talking about it, check if they have an MPH or are boarded in ID. 12/
I am also a full professor at our medical school in Augusta Georgia, and I GUARANTEE you that just because someone is a medical doctor does not in any way mean they understand pandemics. Lean hard on actual epidemiologists, and trust the science. 13/13

 Read on Twitter


