If you're using #ToryRacism, this thread may be for you.
It won't tell you the hows/whys of good policy, which is how we end injustice (party politics won't) but it might help you think more deeply about your POV.
I'll begin by using my own ignorant hashtag. #LabourRacism
1)
It won't tell you the hows/whys of good policy, which is how we end injustice (party politics won't) but it might help you think more deeply about your POV.
I'll begin by using my own ignorant hashtag. #LabourRacism
1)
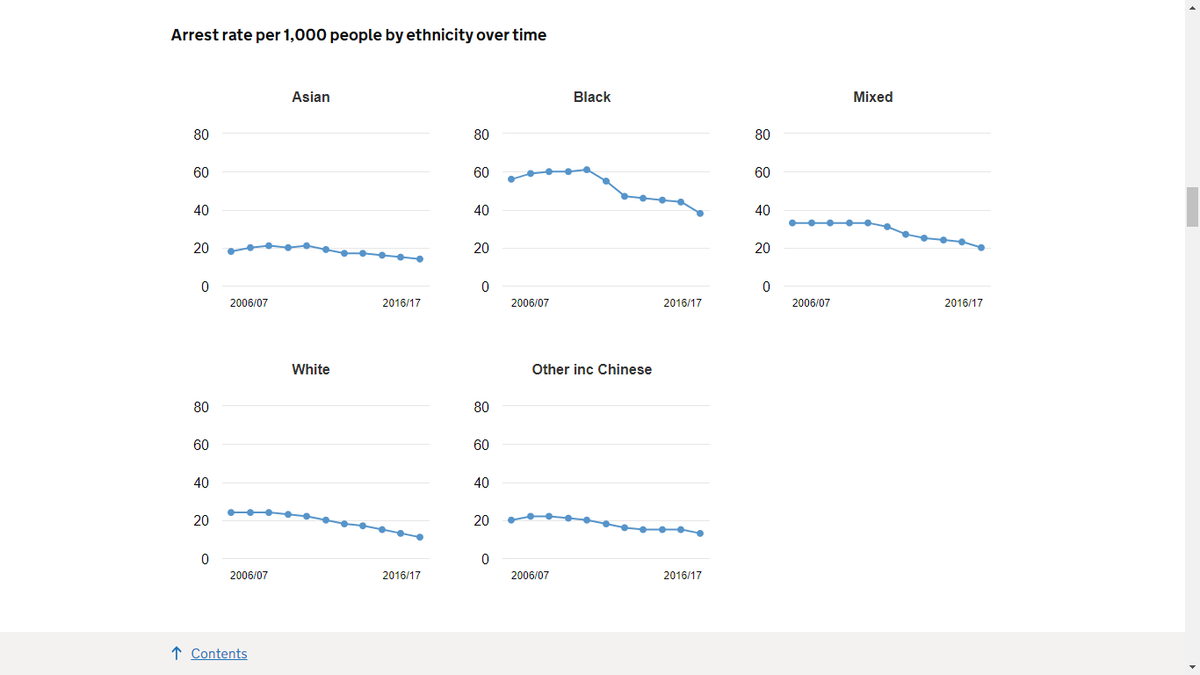
When looking at English & Welsh arrests per 1,000 people, a clear trend has emerged since 2006/07.
All ethnicities have seen a considerable drop, particularly in the black community, which has seen 34,201 fewer arrests.
Welcome statistics.
2)
All ethnicities have seen a considerable drop, particularly in the black community, which has seen 34,201 fewer arrests.
Welcome statistics.
2)
Here's some raw data to show that decrease.
51% drop in White arrests
33% drop in Black arrest
26% drop in Asian arrests
39% drop in Mixed arrests
38% drop in Chinese/other arrests
48% drop overall
Some people will be screaming, 'we have fewer police, with fewer resources'!
3)
51% drop in White arrests
33% drop in Black arrest
26% drop in Asian arrests
39% drop in Mixed arrests
38% drop in Chinese/other arrests
48% drop overall
Some people will be screaming, 'we have fewer police, with fewer resources'!
3)
Agreed. So it's probably a good idea to consider other stats, like conviction rates. They are potentially better indicators than arrests, which could be inappropriate
This graph shows that despite fewer arrests, conviction rates have actually increased for all ethnicites.
4)
This graph shows that despite fewer arrests, conviction rates have actually increased for all ethnicites.
4)
This unwieldy graph is the above data in a bar chart & gives an easier view of the conviction percentages.
This is set against a backdrop of reported crime & surveys, showing a reduction in crime as a whole.
Certain crimes, for example: knife crime, has gone up considerably.
5)
This is set against a backdrop of reported crime & surveys, showing a reduction in crime as a whole.
Certain crimes, for example: knife crime, has gone up considerably.
5)
When we look more closely at prosecutions & convictions in the category 'Black ethnicity', it is clear that there have definitely been improvements, with a closing of the prosecutions & convictions, and decrease overall.
This would indicate that policing reforms have worked.
6)
This would indicate that policing reforms have worked.
6)
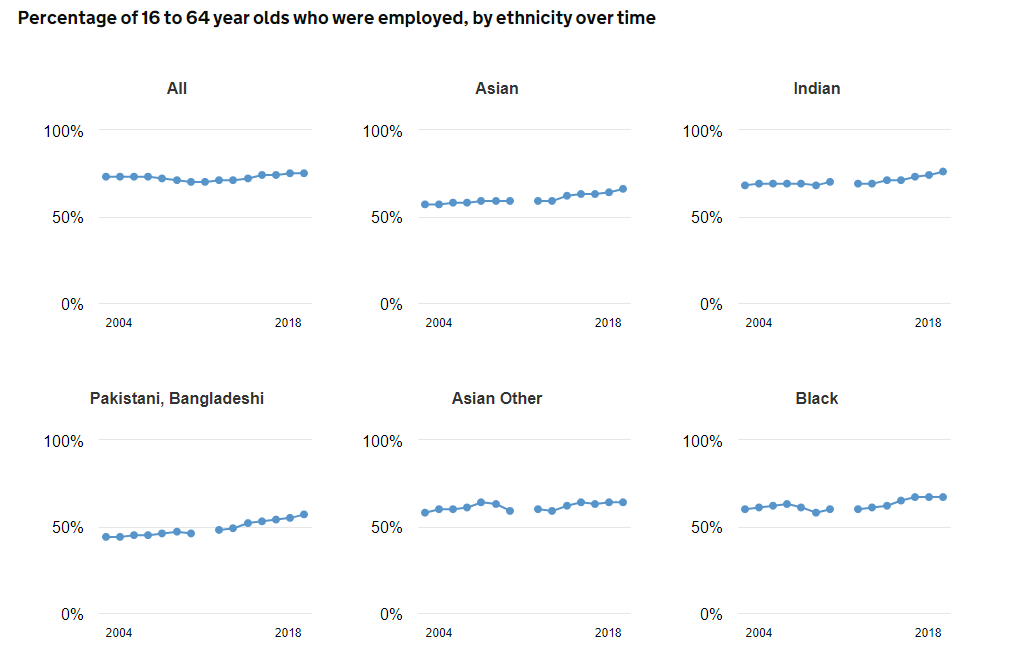
Crime is a one indicator of failure/success, particularly as #BlackLivesMatter  highlights profiling issues but so is employment.
Every non-white category has seen considerable employment increases. The most deprived ethnicity, Pakistani/Bangladeshi's, have seen huge increases.
7)
 highlights profiling issues but so is employment.
Every non-white category has seen considerable employment increases. The most deprived ethnicity, Pakistani/Bangladeshi's, have seen huge increases.
7)
The group which hasn't seen great increases, are white British. However, their population makeup is much greater, so the 2% increase will be a huge population number.
Another caveat must be that these stats are after the financial crash of 2007.
8)
Another caveat must be that these stats are after the financial crash of 2007.
8)
This graph, plots all, white & non-white employment, since 2004..
When interpreting this data, it's important to remember most jobs require a few years of training, which may explain the 2011-14 jump.
9)
When interpreting this data, it's important to remember most jobs require a few years of training, which may explain the 2011-14 jump.
9)
As I mentioned population makeup earlier, these are the 2011 census statistics showing the ethnic composition of the UK. This may help to consider how all these stats may translate.
For the record, when asked, I put 'European other', or 'other'.
10)
For the record, when asked, I put 'European other', or 'other'.
10)
Employment is predicated on education, whether formal or informal. I thought it might therefore be helpful to include some stats on people entering (not completing) higher education.
11)
11)
These graphs show a clear increase in people going into sustained education, employment or apprenticeships after Key Stage 4. Though there are some concerns, such as plateaus and drops in Mixed and Asian ethnicities.
12)
12)
Thankfully, when we move to the same statistics but on Key Stage 5, Mixed and Asian ethnicities see slight improvements. Again, all communities have seen a rise since 2010/11.
13)
13)
Finally, I wanted to focus a little on immigration detention because #Windrush still hurts.
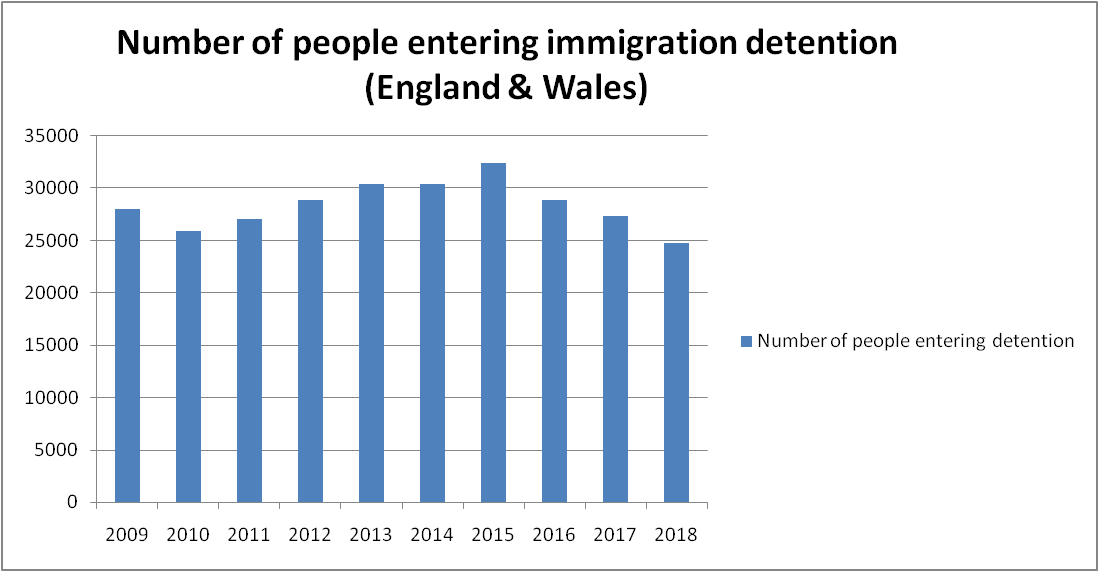
Firstly, we have seen a decrease in people entering the immigration and detention system. Not a marked decrease but certainly not a wild increase, which some may have assumed.
14)
Firstly, we have seen a decrease in people entering the immigration and detention system. Not a marked decrease but certainly not a wild increase, which some may have assumed.
14)
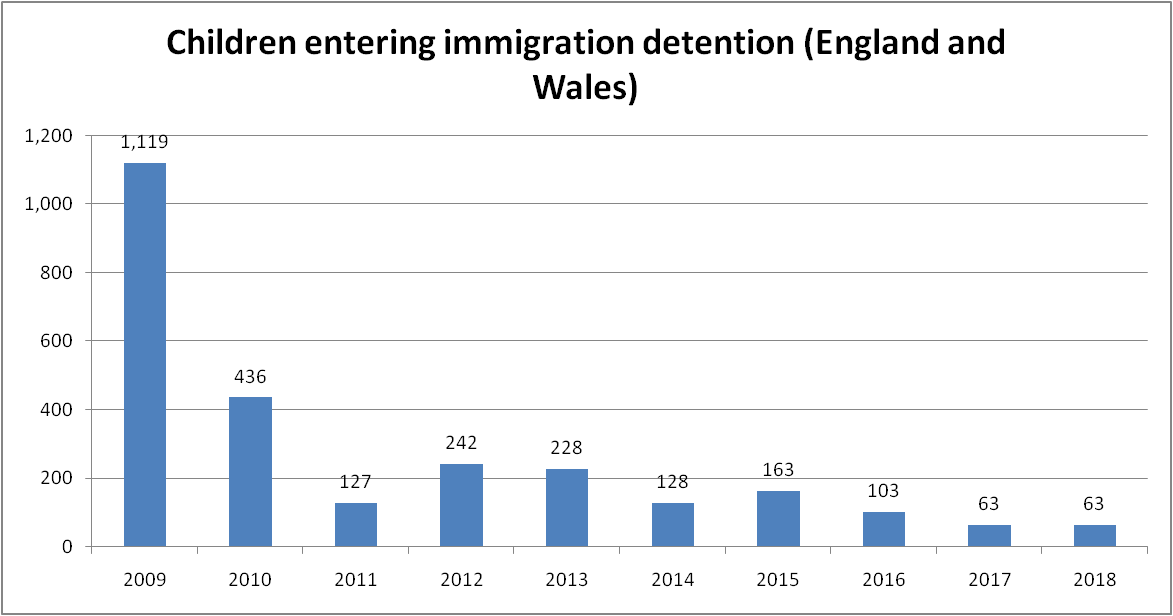
As part of that, is the number of children in immigration detention. This is where we have seen a marked decrease. Despite not having stats from before 2008, this article highlights that more than 1,300 children were detained in 2008.
15)
https://www.independent.co.uk/news/uk/this-britain/detaining-children-in-britain-no-place-for-the-innocent-1864768.html
15)
https://www.independent.co.uk/news/uk/this-britain/detaining-children-in-britain-no-place-for-the-innocent-1864768.html
Rather than adding many tweets from many nations/regions, I wanted to focus on the African Sub-Saharan enforced UK removals/refused entry, since 2006.
Huge change has taken place in the last 14 years, with the numbers dropping considerably and then steadying.
16)
Huge change has taken place in the last 14 years, with the numbers dropping considerably and then steadying.
16)
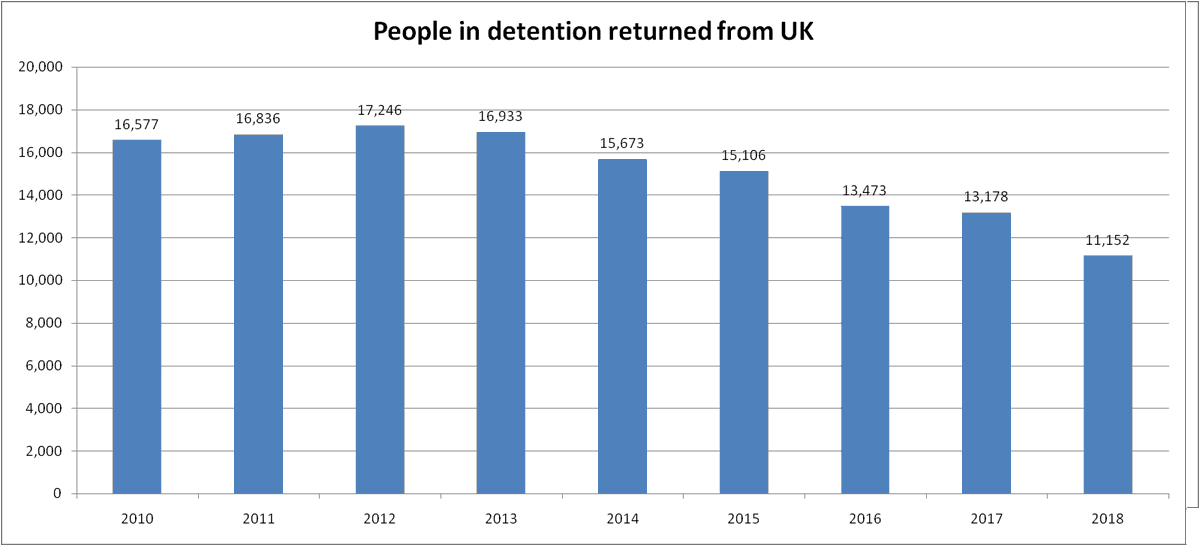
The overall statistics also support this trend. Those people in detention & returned from the UK have decreased by more than 3,000.
Does that mean we haven't seen failings? eg- #Windrush, absolutely not but why did we focus so heavily on party politics, rather than solutions?
17)
Does that mean we haven't seen failings? eg- #Windrush, absolutely not but why did we focus so heavily on party politics, rather than solutions?
17)
This is the crux of this thread. A focus on party politics sets us back. There's a time & place to campaign & win/keep votes but we can't keep avoiding honest debate.
We all have opinions but surely policy and honest debate must come first?
18)
We all have opinions but surely policy and honest debate must come first?
18)
Party politics obscures truth & change. And it plays out worldwide.
Eg- This chart shows asylum admittance in the United States.
How many people would tell you Obama & Clinton's refugee admittance paled into insignificance, compared with Bush Seniors?
19)
Eg- This chart shows asylum admittance in the United States.
How many people would tell you Obama & Clinton's refugee admittance paled into insignificance, compared with Bush Seniors?
19)
So far, lot's of facts, so these final tweets are opinions.
If you're using #ToryRacism, you're part of the problem & should expect criticism, or #LabourRacism retorts.
There's plenty of unproductive evidence for it.
But neither approach will fix anything, more quickly!
20)
If you're using #ToryRacism, you're part of the problem & should expect criticism, or #LabourRacism retorts.
There's plenty of unproductive evidence for it.

But neither approach will fix anything, more quickly!
20)
Instead, consider the voice of the unheard, even if it makes you uncomfortable.
If you're British, think about #Brexit. How @Nigel_Farage was legitimised, what you missed & whether 52% were really racist, or you were too entrenched to welcome difficult debate?
#ReferendumRiot
21)
If you're British, think about #Brexit. How @Nigel_Farage was legitimised, what you missed & whether 52% were really racist, or you were too entrenched to welcome difficult debate?
#ReferendumRiot
21)
This month has shown us that there are many unheard voices & while the UK hasn't seen US style riots, we won't change society any quicker by pushing voices aside.
#BlackLivesMatter
Forcing change is much harder than inspiring it. Ask
@RealDarylDavis
22)
#BlackLivesMatter

Forcing change is much harder than inspiring it. Ask
@RealDarylDavis
22)
Continued....
Somebody highlighted housing so I thought I would update my statistics to look at access to tenure by ethnicity and how that has changed over time.
Rather than looking at overall percentage statistics, I looked at ethnicity trends in ownership, social & rented. 23)
Somebody highlighted housing so I thought I would update my statistics to look at access to tenure by ethnicity and how that has changed over time.
Rather than looking at overall percentage statistics, I looked at ethnicity trends in ownership, social & rented. 23)
This graph shows that White, Black & Other ethnicities have followed the recent national trend of decreased home ownership. Whereas in recent years, Mixed & Asian have reversed it. The greatest drop was between 2006-2011, which hit ethnic communities the hardest. 24)
When we look at the number of homeowners by ethnicity, it's clear that great strides were made between 2001 and 2006. Drops seen between 2006-11, were reversed between 2011 and 2016.
I removed 'White' because the numbers made it harder to compare other ethnicity differences. 25)
I removed 'White' because the numbers made it harder to compare other ethnicity differences. 25)
When looking at 'White' ethnicity, we actually see a marked difference in the total number of home owners compared with other ethnicities and a considerable decrease in the total number. A trend which unlike all other ethnicities, does not change between 2011-2016. 26)
The trends seen above continue in social housing (apart from for Mixed), where White ethnicities have seen a considerable drop in access, particularly between 2001 and 2006, while all other ethnicities have seen a historical increase.
27)
27)
In private rented, all groups experience increases, with White & Asian ethnicities seeing the greatest climb and doubling private renters since 2001.
The dysfunctional housing market certainly does not see ethnicity as an issue, with almost everyone paying more & losing out.
28)
The dysfunctional housing market certainly does not see ethnicity as an issue, with almost everyone paying more & losing out.
28)
The above statistics on housing came from the 'Home ownership & Renting: Demographics' report and others came from government datasets and census surveys.
https://commonslibrary.parliament.uk/research-briefings/cbp-7706/ 29)
https://commonslibrary.parliament.uk/research-briefings/cbp-7706/ 29)
Tenure is a difficult comparison because some regions see much more affordable housing & greater numbers of social housing. This may explain the increases in home ownership for Asian & Mixed ethnicities & the lack of it, for Black, who predominantly live in London. 30)
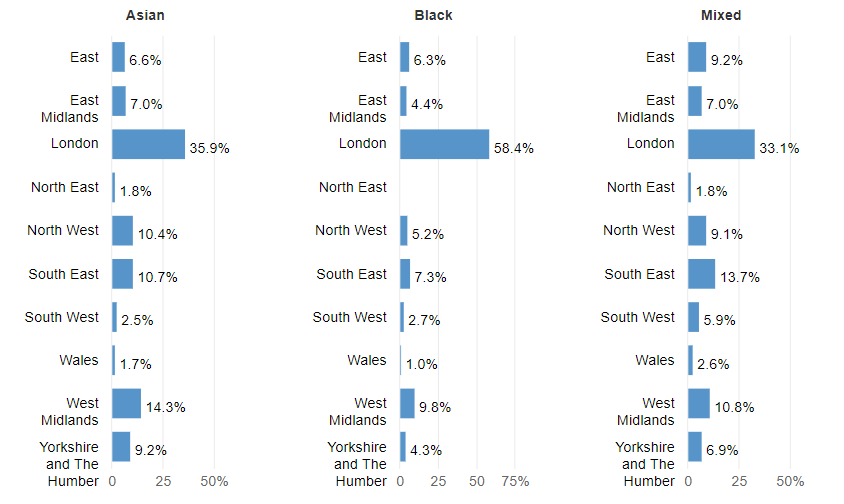
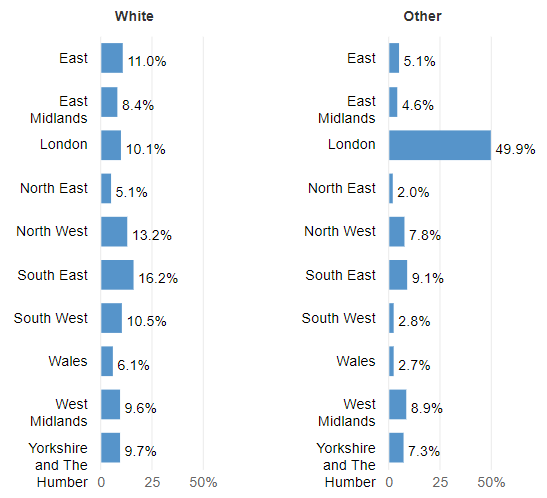
This chart from the 2011 census, further highlights the fact that Black communities live in the most expensive region in the UK, London. Whereas other ethnicities have a greater spread among other regions. 31)
This is a slightly outdated chart showing how expensive London has become over the years, especially for family homes and why everyone struggles to buy in the capital.
32)
32)
Someone suggested I looked at youth crime.
The under 18's secure population rate has declined considerably for all & proportionately, at a decent amount in the BAME community. For the 'Black' community it's been a steady & slow decline but has halved since 2006/07.
33)
The under 18's secure population rate has declined considerably for all & proportionately, at a decent amount in the BAME community. For the 'Black' community it's been a steady & slow decline but has halved since 2006/07.
33)
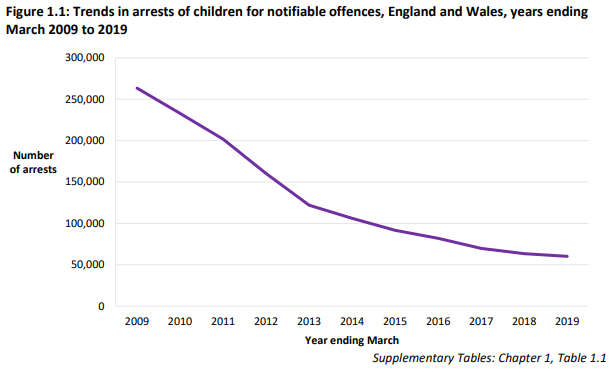
Arrests of children for notifiable offences has gone down. However, the proportion of non-white ethnicities getting arrested has gone up. More data is needed, as there could be regional differences but as shown further above, arrests have decreased & convictions increased.
34)
34)
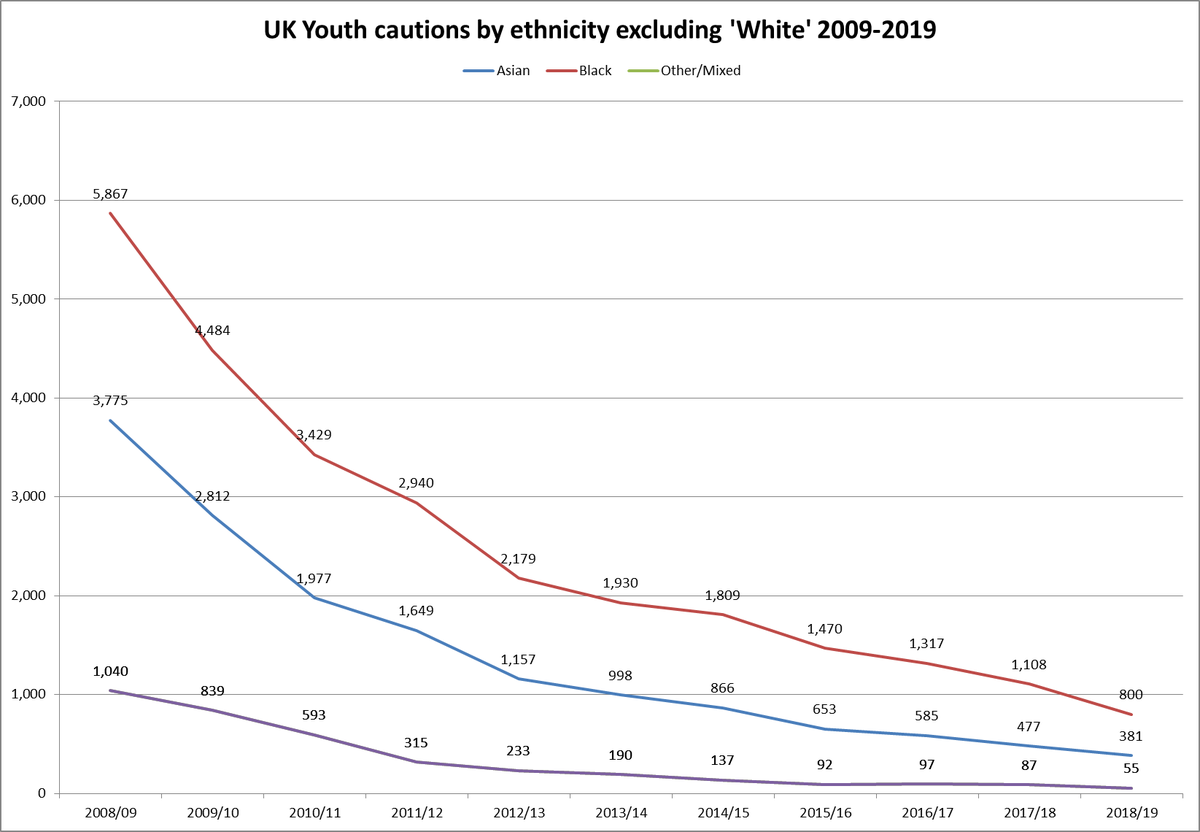
When looking at the same statistics for youth cautions, we see an overall drop but an increase in the proportion of non-white ethnicities getting cautions. This would appear because of the huge drop in white cautions. Black cautions have dropped from 5,867 to 800 in 10 years.
35)
35)
To further illustrate this point, these are the police cautions by ethnicity between 2009 and 2019.
Black - 5,867 to 800
Asian - 3,775 to 381
Other/Mixed - 1,040 to 50
White - 78,124 to 6065 (not included in graph)
#BlackLivesMatter
36)
Black - 5,867 to 800
Asian - 3,775 to 381
Other/Mixed - 1,040 to 50
White - 78,124 to 6065 (not included in graph)
#BlackLivesMatter

36)

 Read on Twitter