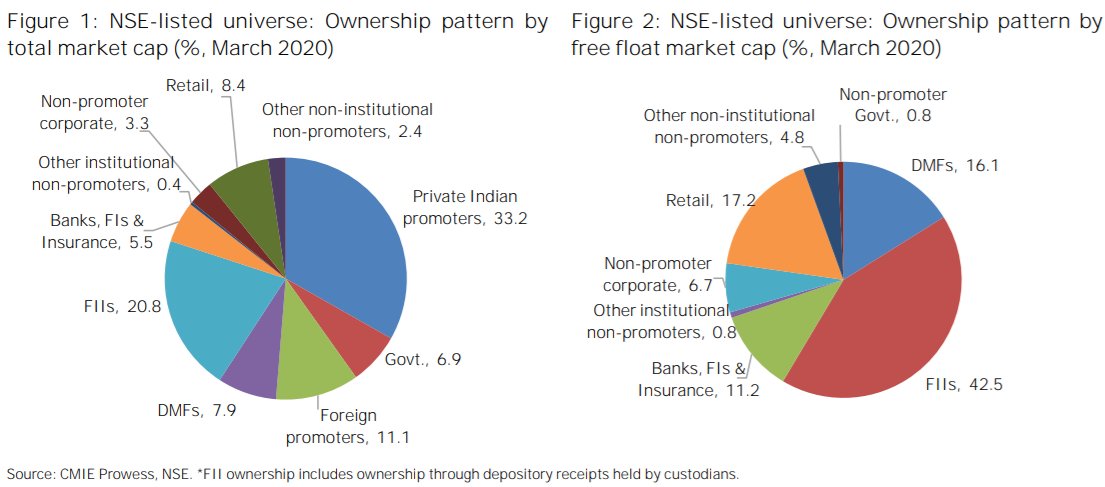
(1/n) NSE Listed universe ownership trends:
- Total promoter ownership in NSE-listed #stocks by ~110bps (QoQ) to near 5 yr high of 50.9%
- FII ownership 133bps (QoQ) to a 5 qtr low of 20.8% (highest sequential decline on a qtrly basis over last 19 yrs)
Src: NSE
#investments
- Total promoter ownership in NSE-listed #stocks
 by ~110bps (QoQ) to near 5 yr high of 50.9%
- FII ownership
 133bps (QoQ) to a 5 qtr low of 20.8% (highest sequential decline on a qtrly basis over last 19 yrs)
Src: NSE
#investments
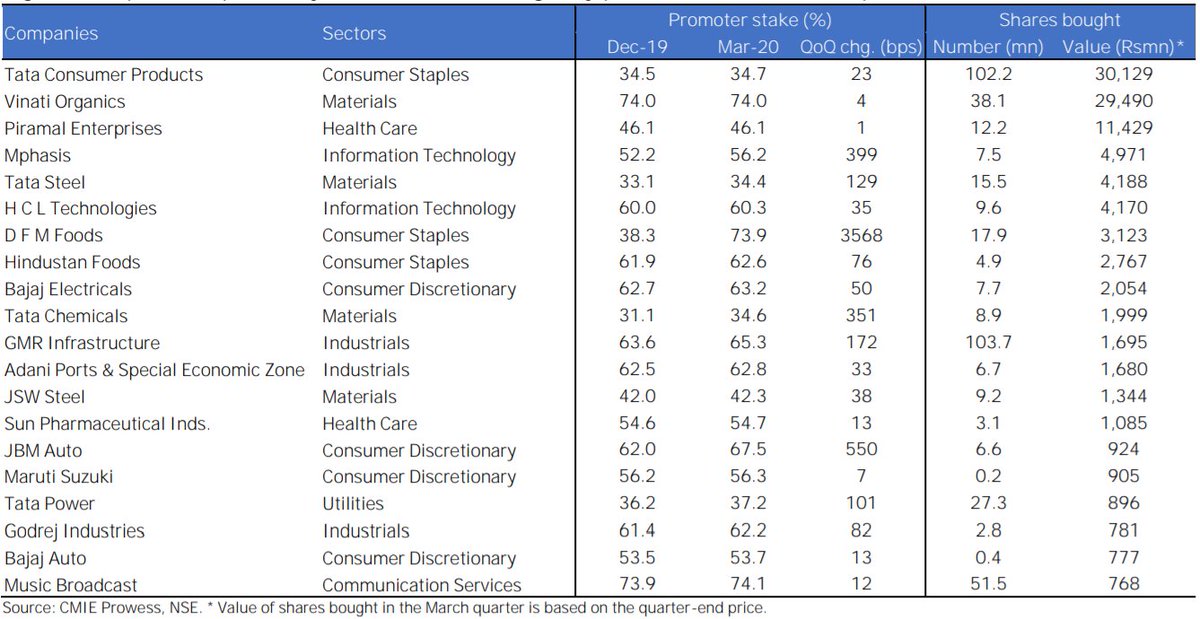
(2/n) Top 20 companies by value of shares bought by promoters in the March quarter.
#investments #investors #stockmarkets #stocks #NSE #economy #lockdown2020
#investments #investors #stockmarkets #stocks #NSE #economy #lockdown2020
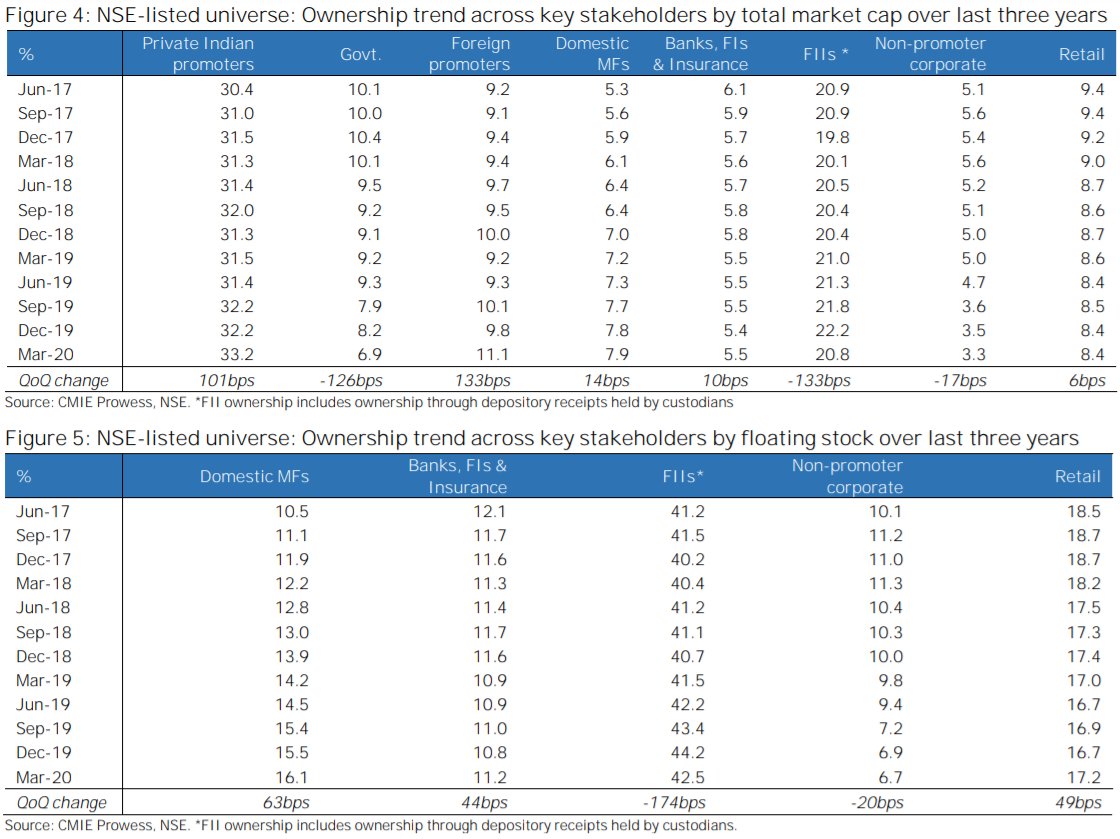
(3/n)
Ownership trend across key stakeholders by TOTAL market cap over last 3 years &
Ownership trend across key stakeholders by FLOATING stock over last 3 years
#investing #stockmarkets #investments #stocks #Nifty50 #Nifty #equities #trading
Ownership trend across key stakeholders by TOTAL market cap over last 3 years &
Ownership trend across key stakeholders by FLOATING stock over last 3 years
#investing #stockmarkets #investments #stocks #Nifty50 #Nifty #equities #trading
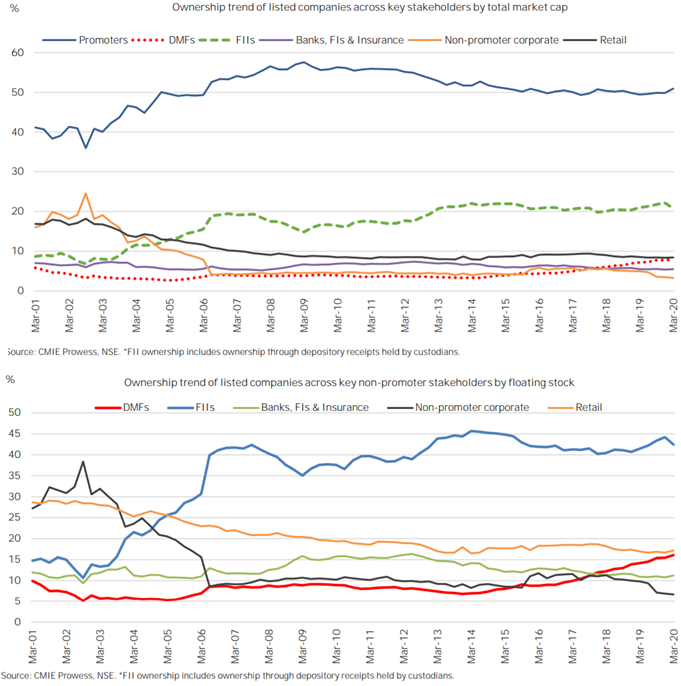
(4/n) Long-term ownership trend across key stakeholders by total market cap (top half of image) and by free float market cap (bottom half)
#investment #equities #financials #economy #India
#investment #equities #financials #economy #India
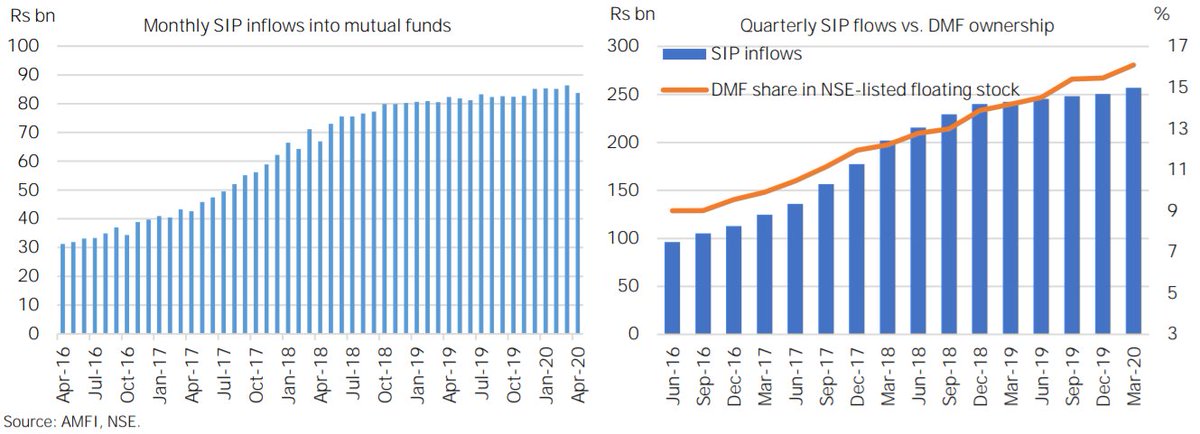
(5/n) #Mutualfunds: SIP inflows in FY20 grew at 8% YoY on top of a 38% growth in FY19. (image 1).
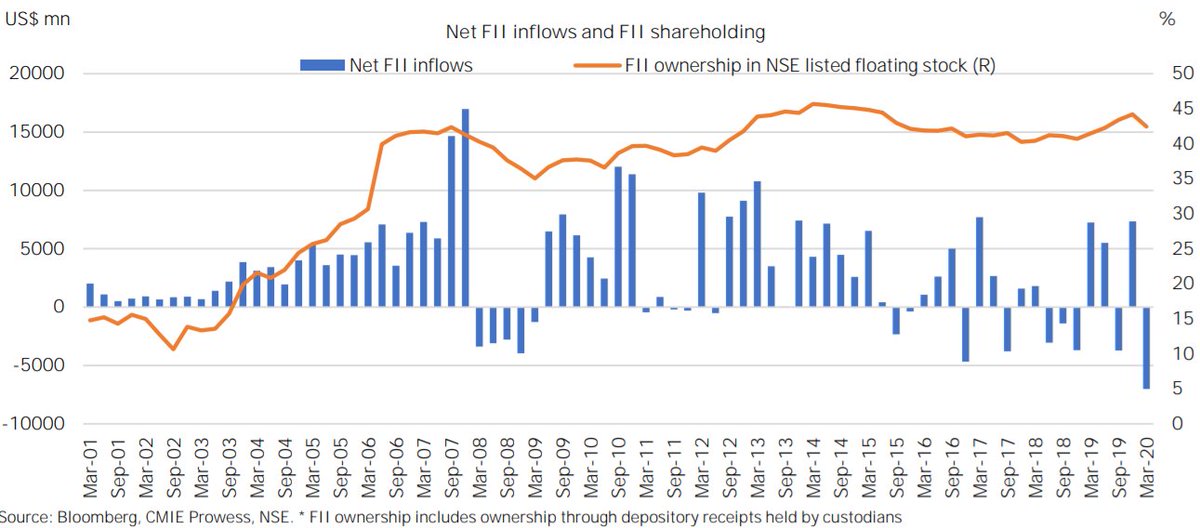
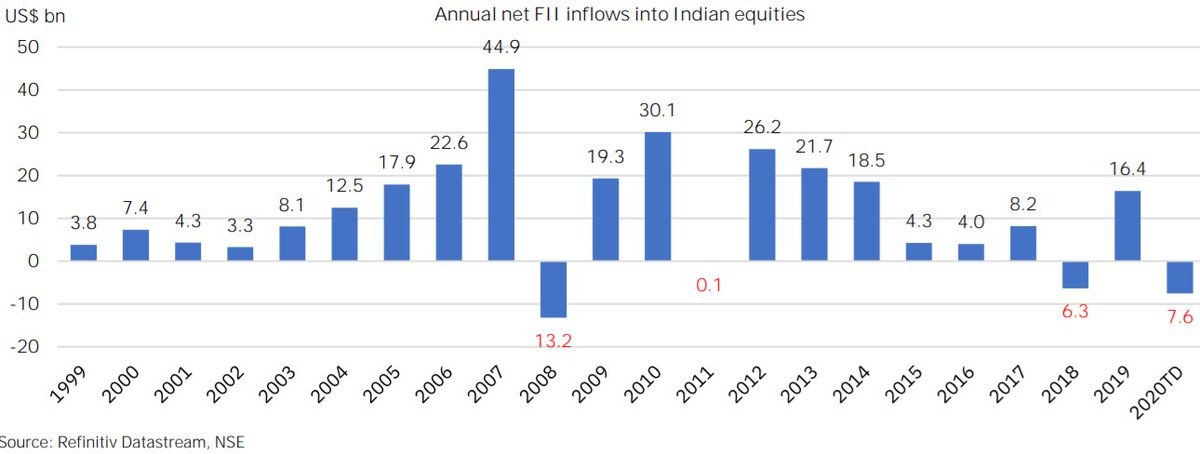
After a 5yr high net FII inflows of US$16.4bn in 2019, Mar qtr of 2020 saw record qtrly FII outflows of US$7bn.
Net FII inflows & FII holding in NSE listed floating stock (image 2).
After a 5yr high net FII inflows of US$16.4bn in 2019, Mar qtr of 2020 saw record qtrly FII outflows of US$7bn.
Net FII inflows & FII holding in NSE listed floating stock (image 2).
(6/n)
Annual net FII inflows trend (image 1)
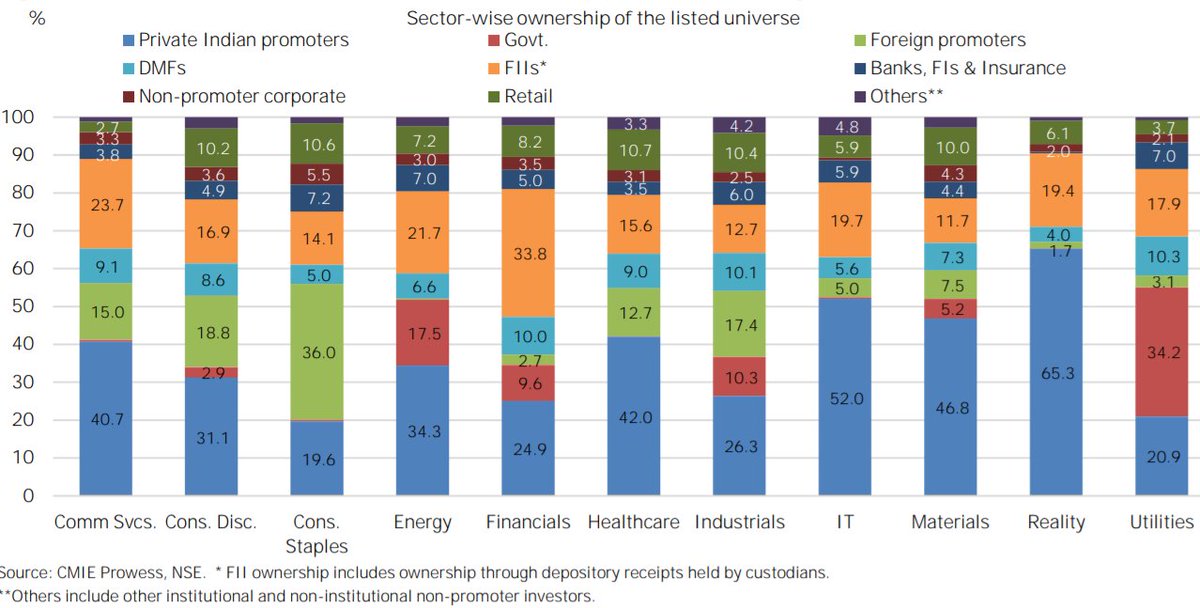
Sector-wise ownership of #NSE #stocks: (Image 2)
- #Realestate has highest promoter ownership at 67.0%
followed by Materials at 57.7% & IT at 57.4%.
- Govt ownership in NSE-listed Cos in Utilities sector is lowest since Jun 2006
Annual net FII inflows trend (image 1)
Sector-wise ownership of #NSE #stocks: (Image 2)
- #Realestate has highest promoter ownership at 67.0%
followed by Materials at 57.7% & IT at 57.4%.
- Govt ownership in NSE-listed Cos in Utilities sector is lowest since Jun 2006
(7/n)
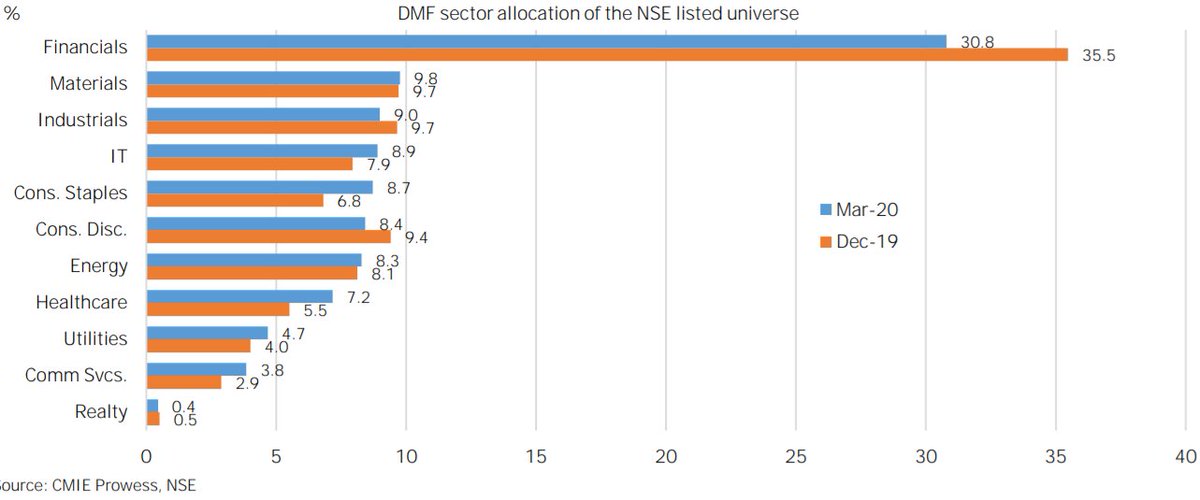
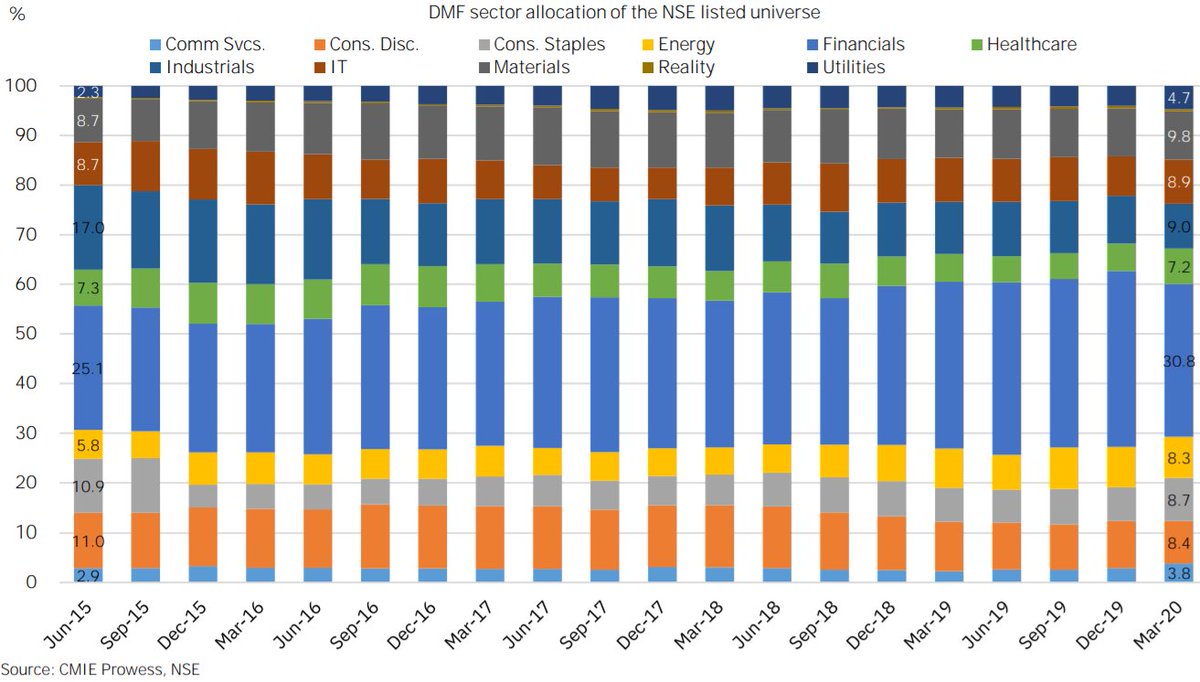
Domestic Mutual Funds: sector allocation of the NSE-listed universe:
Image 1: (Mar 2020 vs. Dec 2019)
Image 2: over last five years
For full report: Refer to: https://static.nseindia.com/s3fs-public/inline-files/Indian%20ownership%20report_March%202020.pdf
The end
Domestic Mutual Funds: sector allocation of the NSE-listed universe:
Image 1: (Mar 2020 vs. Dec 2019)
Image 2: over last five years
For full report: Refer to: https://static.nseindia.com/s3fs-public/inline-files/Indian%20ownership%20report_March%202020.pdf
The end


 Read on Twitter