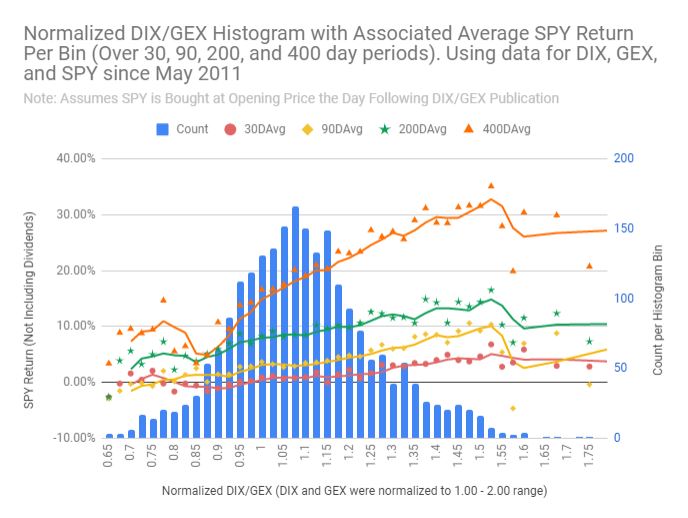
Examining SPY returns vs a ratio of normalized DIX and GEX (for 30, 90, 200, and 400 trading day hold periods). Assumes SPY is bought at opening price the day after DIX and GEX are published. Dividends not included in return calculations. @SqueezeMetrics @PeterKReilly
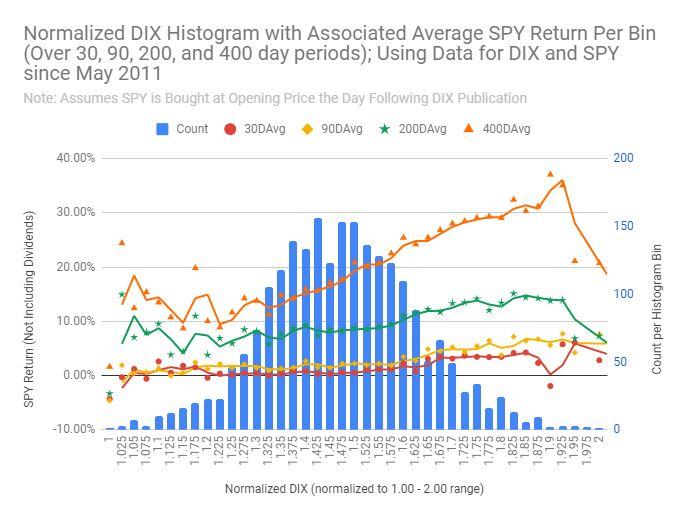
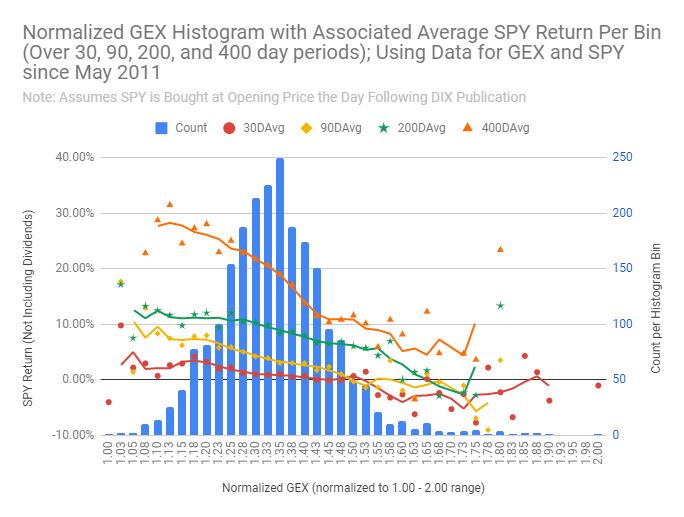
2/ What if examined the same return periods for normalized DIX and GEX in isolation? DIX only below. GEX to follow.
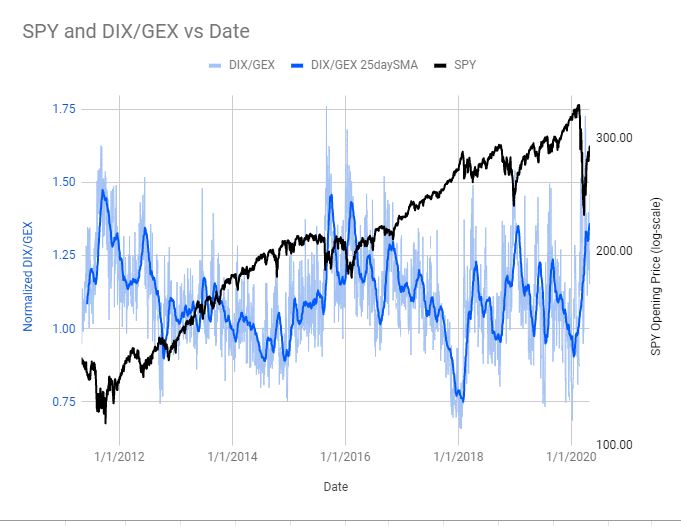
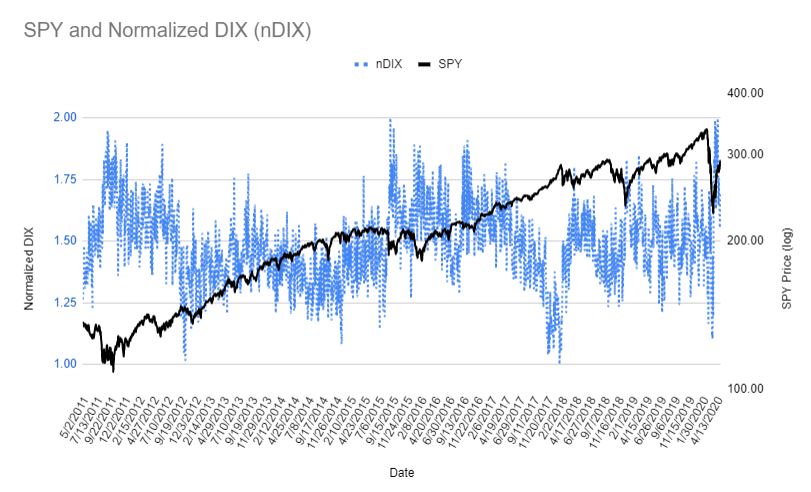
Here's a look at DIX/GEX and SPY over time since May 2011 (i.e. since DIX/GEX data available). Can a set DIX/GEX value signal a good time to move to cash? To apply more leverage? To short? Coming soon...
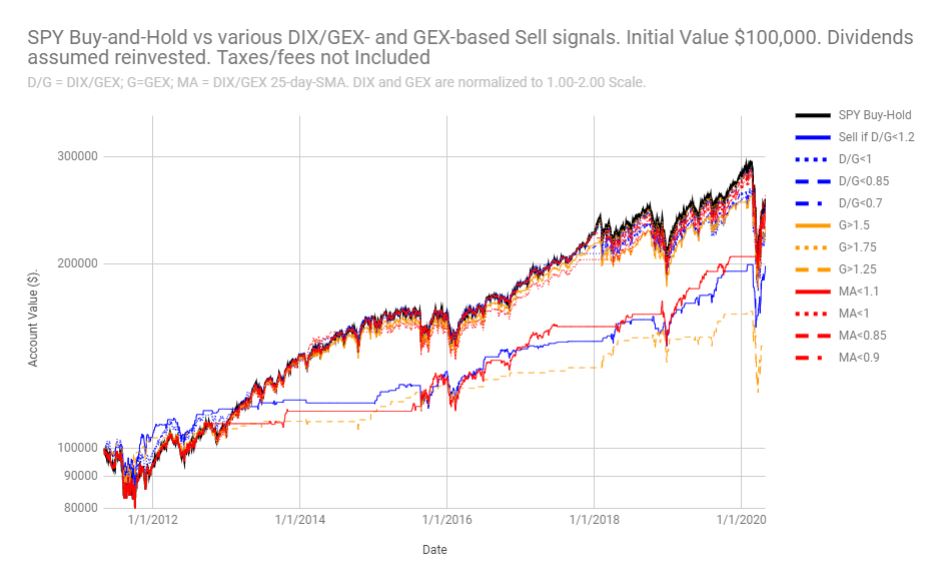
Would a DIX/GEX, GEX, or DIX/GEX Moving Average binary sell rule in a long-or-cash only strategy beat an SPY buy-and-hold strategy over 2011-present? Tested a range of cutoffs for these as shown in plot below. No sell rule consistently beat buy-and-hold...yet. @ReformedTrader
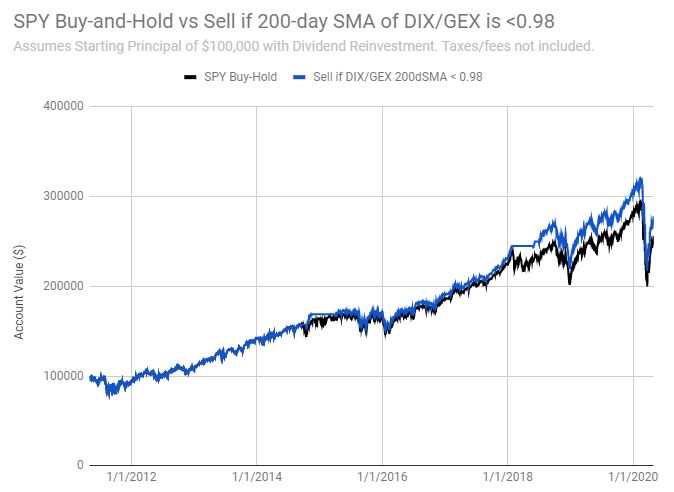
If I overengineer a 200-day moving average rule to go to cash, the strategy beats Buy-and-Hold. A change of the cutoff by 0.05, and we no longer beat B&H. Hence, overengineered.
Using a normalized DIX/GEX ratio seems to have made a binary sell cutoff more difficult given changes in volatility (GEX) over time. Using normalized DIX (nDIX) alone would likely improve our ability to make a long-or-cash model with specific sell triggers. Here's nDIX and SPY.
However, given the volatility of nDIX, such a hard cutoff for a sell and buyback signal in this long-or-cash model would result in hundreds of trades and whipsaw losses. We can use a moving average of nDIX or a windowed sell strategy (i.e. sell if nDIX< x, buyback when nDIX>y).
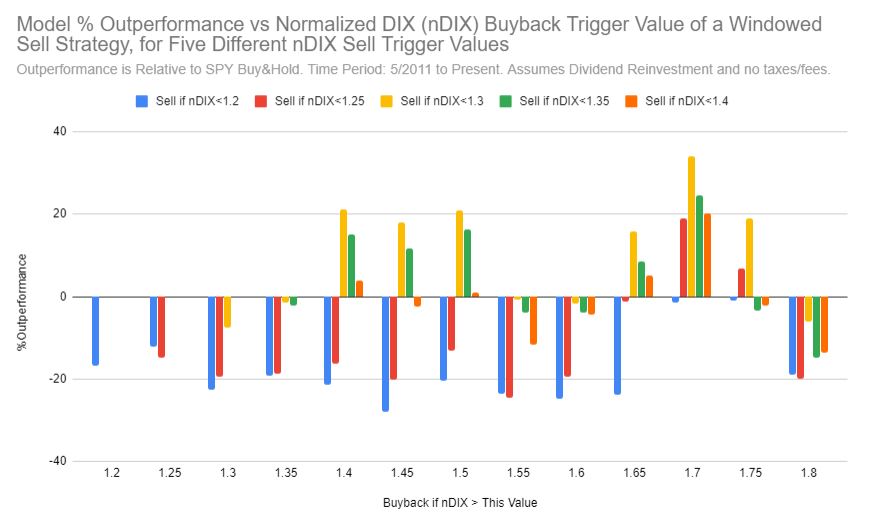
To avoid using a lagging moving average sell/buyback trigger, I've tested various combinations of nDIX<x sell triggers and nDIX>y buyback triggers for an optimal combo. Optimization parameters:
1) maximize final outperformance vs SPY Buy&Hold
2) minimize trades. @SqueezeMetrics
1) maximize final outperformance vs SPY Buy&Hold
2) minimize trades. @SqueezeMetrics
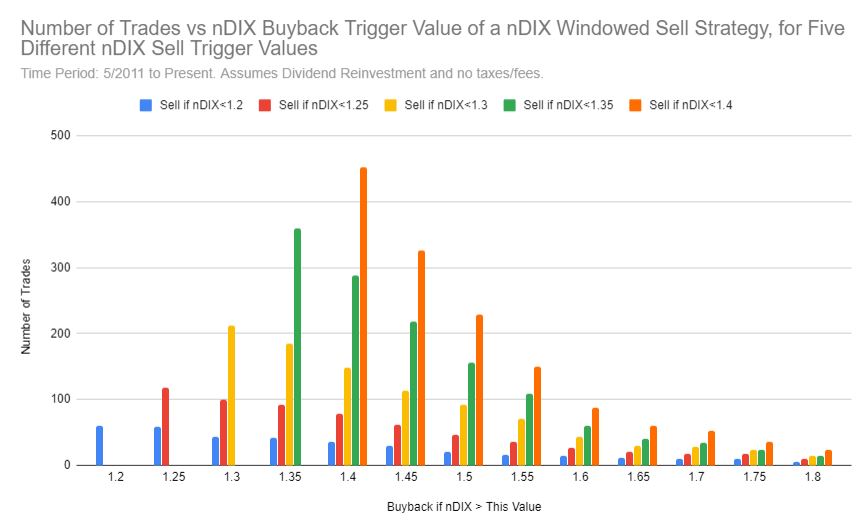
Similarly, this chart shows the number of trades for each of these combinations. Fortunately and logically, the models (e.g. Sell<1.3, Buyback>1.7) with the best final performance have rather large sell-buyback windows, therefore requiring fewer trades. @PeterKReilly @ThoughtBow
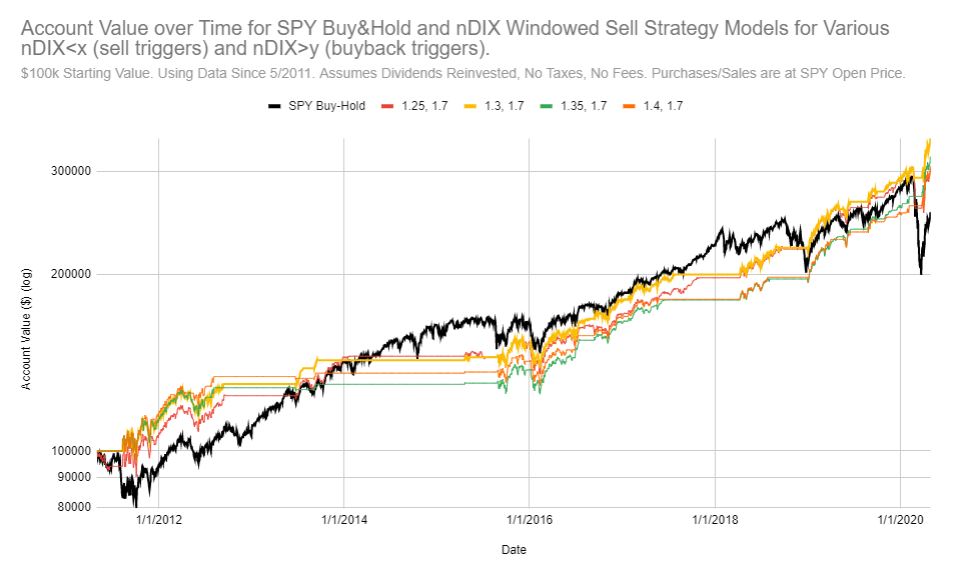
This chart shows account values over time for the best-performing windowed nDIX sell/buyback models compared to SPY Buy&Hold. I'll have max drawdown data soon. Let me know what other metrics you're interested in. @PeterKReilly @SqueezeMetrics @ReformedTrader @ThoughtBow
Improving on this model https://twitter.com/chartstreamer/status/1269732244777820163?s=20
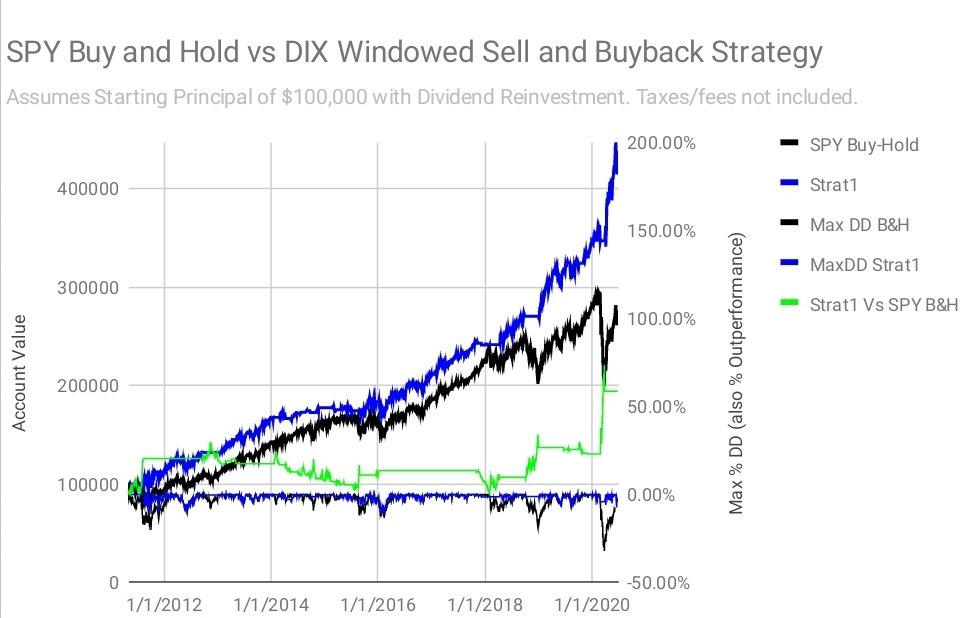
Here's this backtest updated through yesterday, back to a 38.2% DIX sell signal with the 2-day lag corrected. Looks like the alpha needs to mean-revert! Right vertical axis for outperformance and max drawdown lines (the bottom 3 lines)
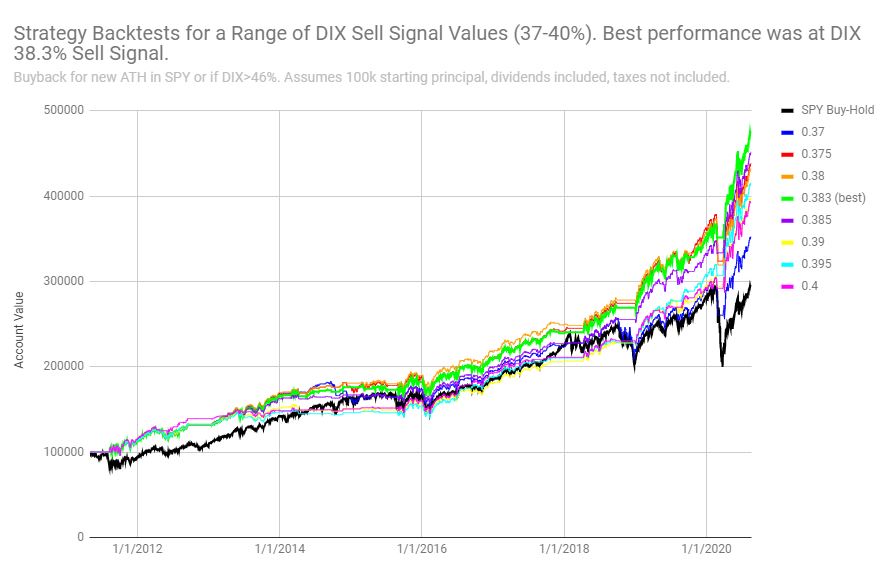
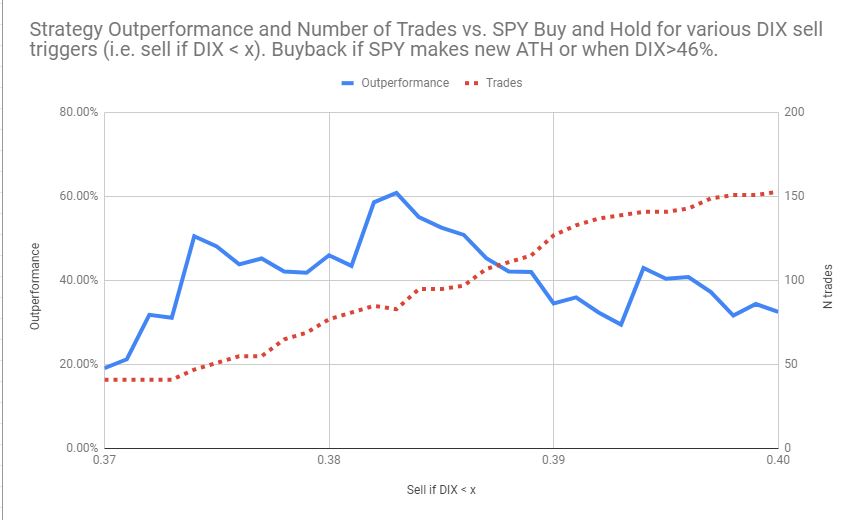
@Manchanach1 wondered how changes in the DIX sell trigger value would affect performance. This chart shows several backtests: a DIX<38.3% sell signal maximizes final outperformance. We assume constant buyback parameters: buyback when DIX>46% or when SPY makes a new ATH.
For higher resolution, this chart shows final outperformance vs SPY for the full range of DIX sell signal values tested (again assuming a constant DIX buyback value). Importantly, it also shows the total number of resulting trades for that sell signal value.
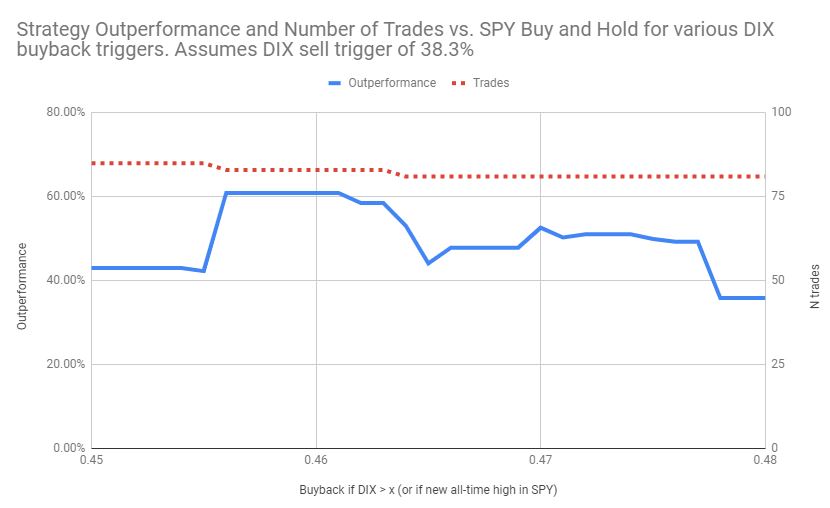
Now you're probably wondering, how robust is your buyback value of DIX 46%? This chart shows (for constant DIX sell signal of 38.3%) the final outperformance for the full range of DIX buyback values over 45-48%.

 Read on Twitter