The Big 2015-2016 & 2019-2020 $BTC fractal.
There is a lot happening here so i'll be explaining it bit by bit in the thread below.
This is just an idea/observation so take everything with a grain of salt.
There is a lot happening here so i'll be explaining it bit by bit in the thread below.
This is just an idea/observation so take everything with a grain of salt.
2) First noteworthy point is the similar drop from top to bottom which were -86% & -84%. After which we rallied 2 times like we see in 2015 and recently in 2019 & early 2020.
Then, the second drop occured bringing us to +29% from the 2015 bottom & +24% from the 2018 bottom
Then, the second drop occured bringing us to +29% from the 2015 bottom & +24% from the 2018 bottom
3) After bottoming a SECOND time, we see the big run up like we're also seeing right now. Where 2015 even saw 10 out of 11 green weekly candles in a row. We're sitting at our 7th as we speak.
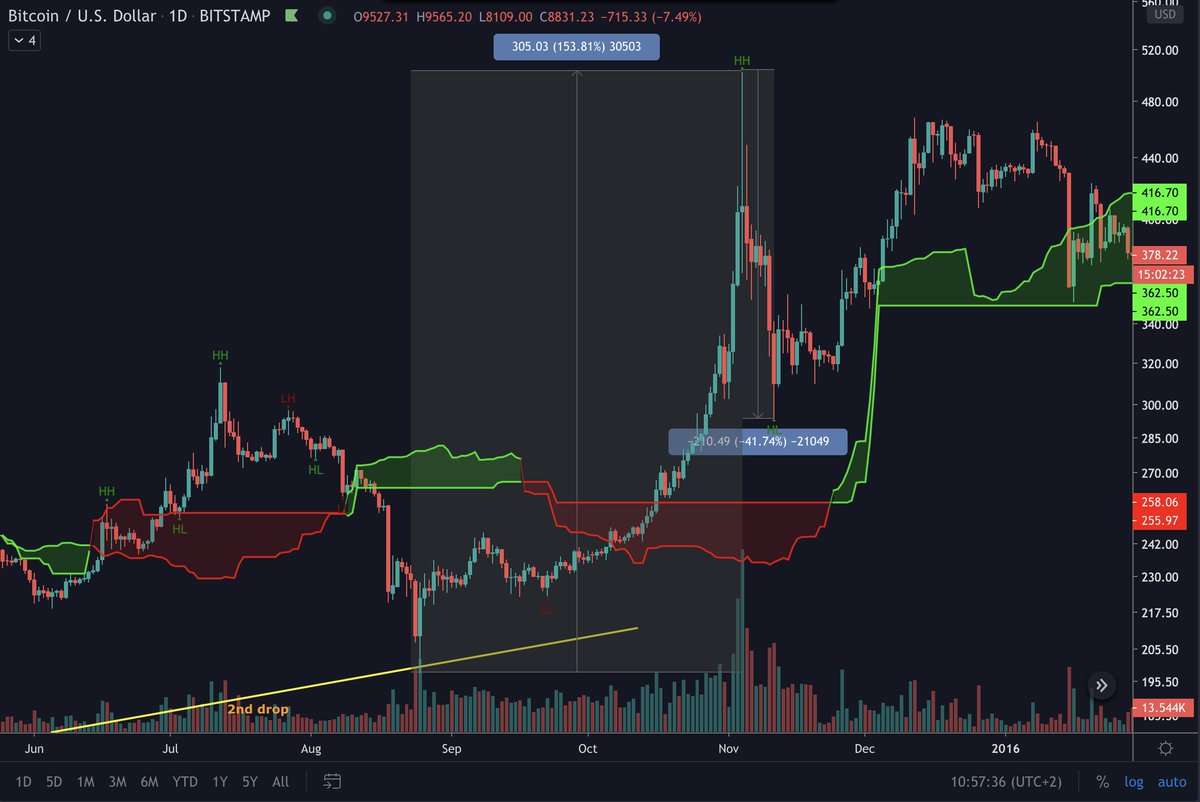
4) After rallying the price bumped against the weekly cloud and had a big of a correction. We're currently already seeing a bit of a rejection from the weekly cloud but didn't reject as hard as in 2015 where it did -42% from the top of the wick to the bottom.
5) After consolidating a bit the price broke through the weekly cloud, rallied on a bit and then we saw about 5-6 months of sideways, slow grind up movements where alts flourished and the $BTC.D dropped from 99.15% to 94.6% top to bottom. (Which is A LOT)
6) Soon after, the breakout of the weekly cloud occured mid 2016 with the Kumo twist happening about half a year after. From breaking out we fell back into the cloud but on breaking out a second time price never looked back and we went on to rally towards the well-known $20K mark
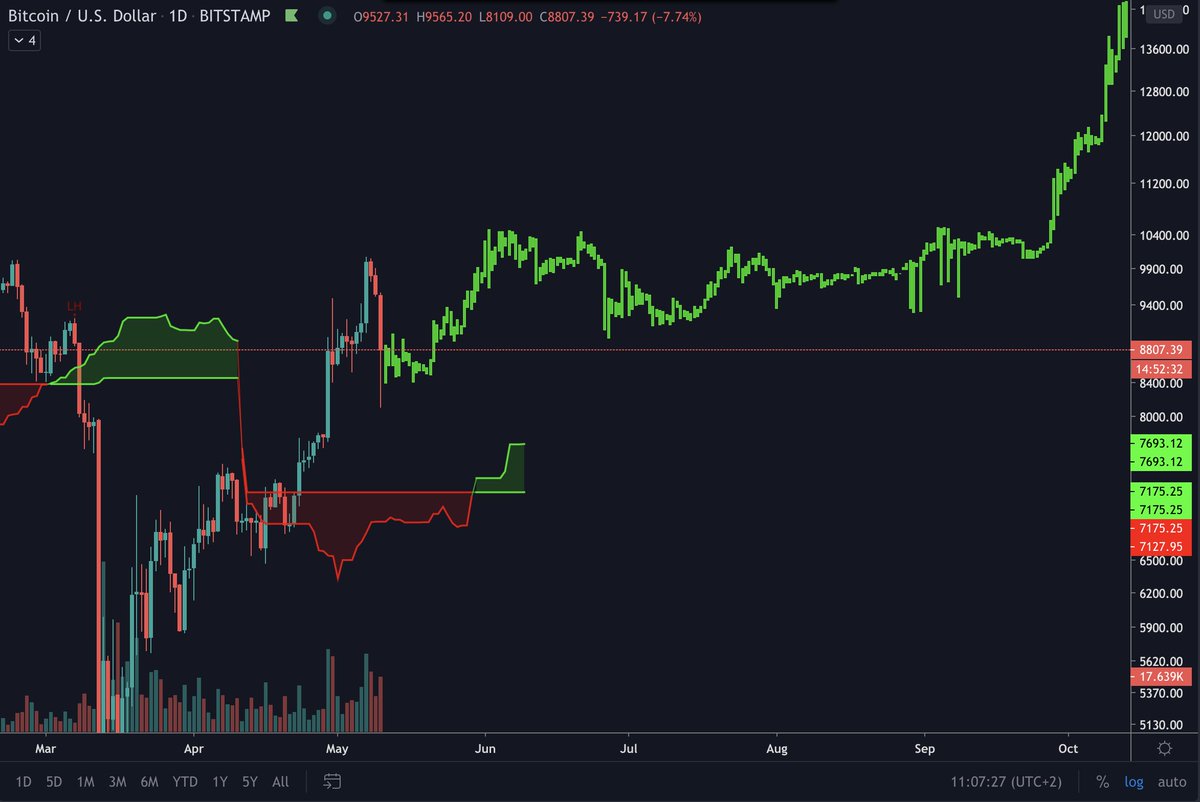
7) I added the bar pattern behind the current price to get an idea of how big this move was and where this would put us at. The price tops out at about $250.000. I wouldn't count on it ever going that high but it's something to keep in mind.
8) Something else to keep in mind is that the 2016 halving occured at the 9th of July. That means our current price action relative to the halving is quite a lot behind. Where we're only touching the weekly cloud now, it happened about 37 weeks before the halving in 2015-2016.
9) For the people that enjoy watching these, i also highlighted a few of the indicators i use and they also show very similar patterns within both periods of time.
10) So what now? I'd say the next big goal is getting into that weekly cloud and staying there. I don't expect price to just run through and break out immediately but a bit of sideways action wouldn't hurt. If we can manage breaking out after that the real fun starts. 

The Big 2015-2016 & 2019-2020 $BTC fractal.
05/10/2020 update.
Still following the fractal. We've now entered into the cloud and wicked back down just like in 2015. The correction was about twice as small but we have to keep in mind the market cap is about 20x as big right now.
05/10/2020 update.
Still following the fractal. We've now entered into the cloud and wicked back down just like in 2015. The correction was about twice as small but we have to keep in mind the market cap is about 20x as big right now.
What's also interesting is that in 2015 we did ~154% from bottom to top.
This time we did 162%. So once again, extremely similar movements. The daily cloud is also showing a very similar picture.
This time we did 162%. So once again, extremely similar movements. The daily cloud is also showing a very similar picture.
IF we were to correct 42% like in 2015 that would set us back to ~$5800.
In relation to the daily cloud this would set us way back below it and this would completely change the picture. Looking at the fractal i'd say there's a reasonable chance this was the dip for this move.
In relation to the daily cloud this would set us way back below it and this would completely change the picture. Looking at the fractal i'd say there's a reasonable chance this was the dip for this move.

 Read on Twitter


