Million $ strategy for free
The "bear trap" & "bull trap" concept using the volume profile POC is very useful in intra-day trading also
Especially in the futures where the buyer & sellers are zero-sum game, for every long there is a short
We had two-days in a row in #ES https://twitter.com/kerberos007/status/1253044050778828800
Million $ strategy for free:
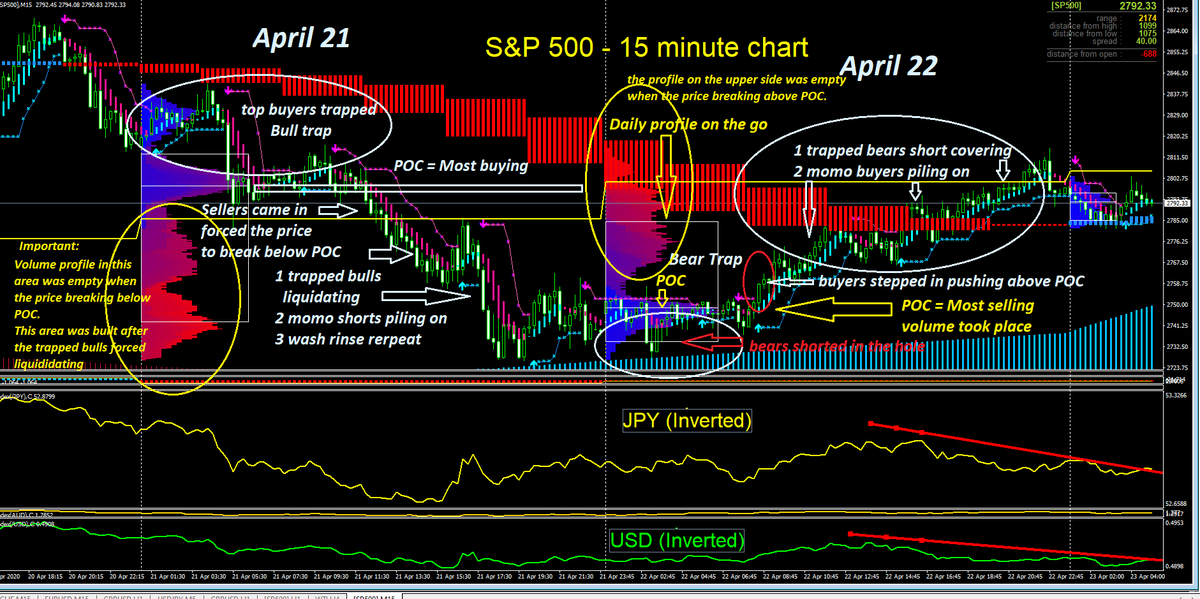
If you can understand the below chart and practice everyday with position sizing & risk mgmt, you will be a successful day traders:
1 April 21 - perfect Bull Trap set up
2 April 22 - perfect Bear trap set up
study it and comprehend
very important
If you can understand the below chart and practice everyday with position sizing & risk mgmt, you will be a successful day traders:
1 April 21 - perfect Bull Trap set up
2 April 22 - perfect Bear trap set up
study it and comprehend
very important
Below thread covered some basics
The above "bear & bull trap" set-up is part of the 5-dimensional day trading system mentioned below
Never published anywhere, now you have it for free
Supply & demand balances at major sup/res zone is KEY to any trading https://twitter.com/kerberos007/status/1119739192383295489
The above "bear & bull trap" set-up is part of the 5-dimensional day trading system mentioned below
Never published anywhere, now you have it for free
Supply & demand balances at major sup/res zone is KEY to any trading https://twitter.com/kerberos007/status/1119739192383295489
Important concept
The above volume profiles were built on the fly
On April 21:
the upper POC profile was built before the breakdown in price; the lower part was empty
The lower part was built after the liquidation
On April 22:
the lower POC was built before the breaking out
The above volume profiles were built on the fly
On April 21:
the upper POC profile was built before the breakdown in price; the lower part was empty
The lower part was built after the liquidation
On April 22:
the lower POC was built before the breaking out
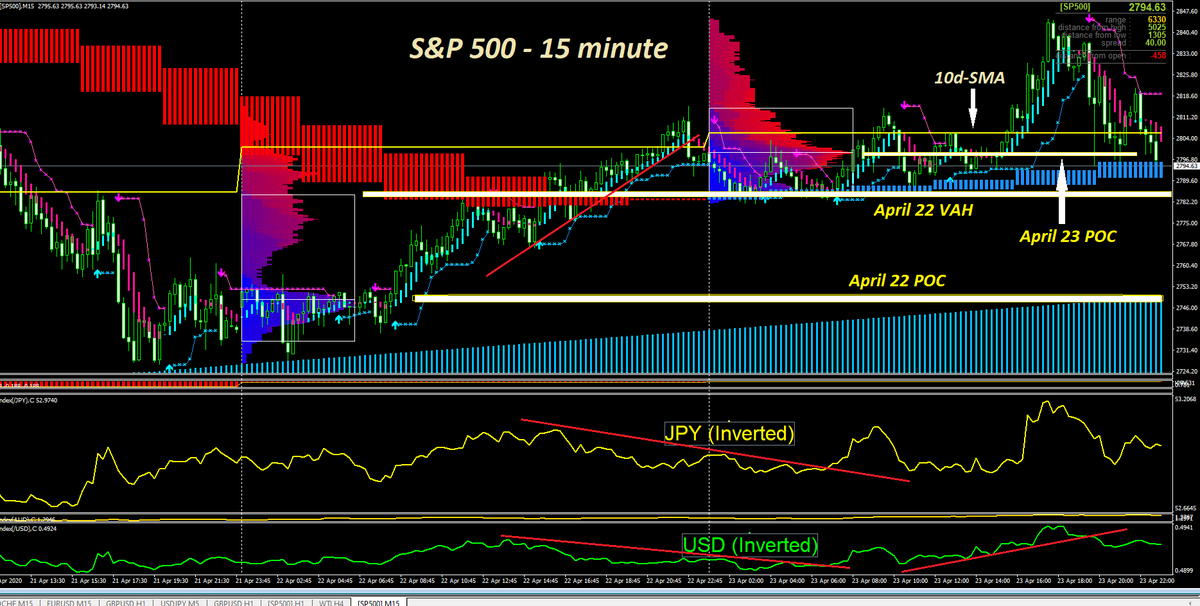
April 23 - Close
Perfect text book support held right at Today's POC.
#ES_F Line in the sand = 2780 for AH overnight session
I marked all the important levels:
Yesterday POC
Yesterday VAH
Today's POC
10day SMA
You might have a different POC dependent on your start time
Perfect text book support held right at Today's POC.
#ES_F Line in the sand = 2780 for AH overnight session
I marked all the important levels:
Yesterday POC
Yesterday VAH
Today's POC
10day SMA
You might have a different POC dependent on your start time
breaking
Another POC bear trap overnight
One more chance to learn the bull/bear trap
Some algos made some pocket changes playing the same game again & again against the retails
April 23 = Bull trap
April 24 ON = Bear trap
If you missed the breakout bar, wait for the retest

Another POC bear trap overnight
One more chance to learn the bull/bear trap
Some algos made some pocket changes playing the same game again & again against the retails
April 23 = Bull trap
April 24 ON = Bear trap
If you missed the breakout bar, wait for the retest
Okay: more free secrets on 5 dimensional trading revealed
More dimensions added to the chart
VSA - 5 min
%B breakout
VSA - 60 min (MTF)
1 breakout bar confirmation: VSA & %B
2 retracement on decreasing VSA & %B confirmation
3 re-entry on re-test of POC on decreasing volume
More dimensions added to the chart
VSA - 5 min
%B breakout
VSA - 60 min (MTF)
1 breakout bar confirmation: VSA & %B
2 retracement on decreasing VSA & %B confirmation
3 re-entry on re-test of POC on decreasing volume
AAII bullish and Bearish weekly sentiment survey
from 2010 to 2020
green = bullish
red = bearish
blue = 5-period SMA (spread) = bullish - bearish
anybody can find any patterns or correlations with $SPX weekly price?
from 2010 to 2020
green = bullish
red = bearish
blue = 5-period SMA (spread) = bullish - bearish
anybody can find any patterns or correlations with $SPX weekly price?
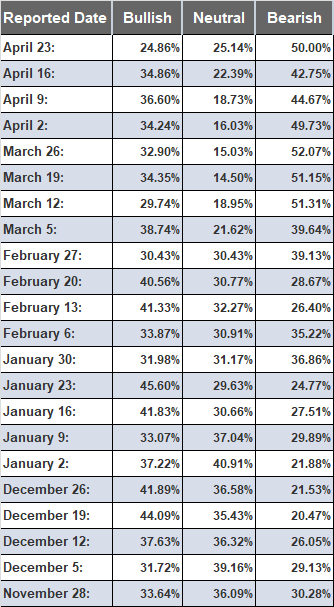
Latest AAII sentiment survey data:
People becoming more bearish and less bullish in April stock ramp.
Contrarian or shrewdness?

we shall see next week.
People becoming more bearish and less bullish in April stock ramp.
Contrarian or shrewdness?


we shall see next week.
Quiz?
Not to outdone the AAII sentiment survey
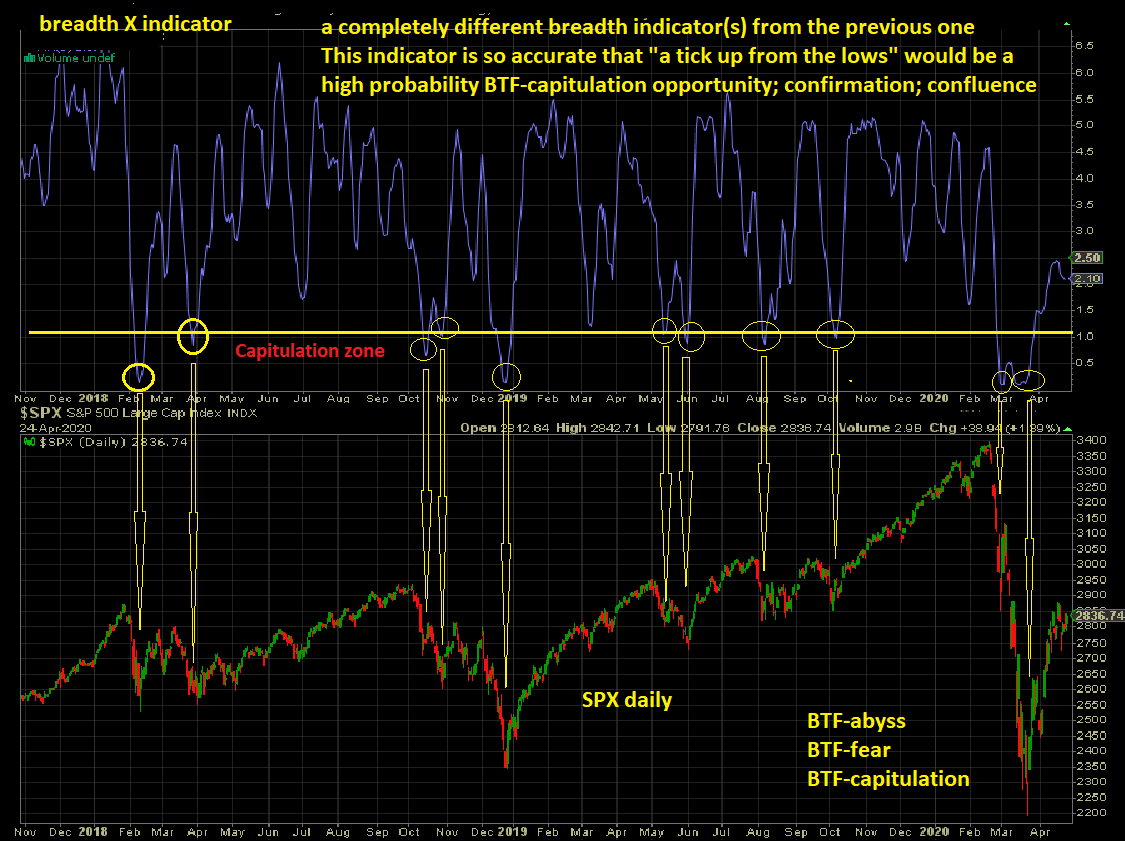
below is a better sentiment indicator for the BTF-fear strategy
When this indi penetrates the capitulation zone (black line) then move above it, time to join the party
Using trailing stop to lock in partial profit & ride the rest
Not to outdone the AAII sentiment survey
below is a better sentiment indicator for the BTF-fear strategy
When this indi penetrates the capitulation zone (black line) then move above it, time to join the party
Using trailing stop to lock in partial profit & ride the rest
Need more confirmations, confluences, etc
A completely non-correlated breadth indicator X would be another great confirmation leading indicator for $BTF-capitulation.
I love confluences & confirmations.
weekend quiz?
A completely non-correlated breadth indicator X would be another great confirmation leading indicator for $BTF-capitulation.
I love confluences & confirmations.
weekend quiz?
Relative performance
Ranking since May 2017:
FANG-MAN = FB AAPL NFLX GOOGL MSFT AMZN NVDA
1 FANG-MAN up 101%
2 XLK up 61.7%
3 XLY up 24.5%
4 SPX up 18.7%
5 XLP up 6.8%
6 RSP (equal weight) flat
7 XLF down -8.1%
Market can't go up with XLF & RSP lagging this much
Ranking since May 2017:
FANG-MAN = FB AAPL NFLX GOOGL MSFT AMZN NVDA
1 FANG-MAN up 101%
2 XLK up 61.7%
3 XLY up 24.5%
4 SPX up 18.7%
5 XLP up 6.8%
6 RSP (equal weight) flat
7 XLF down -8.1%
Market can't go up with XLF & RSP lagging this much

AAII Sentiment survey update:
(Bullish - Bearish) spread just reached a cycle low last week.
See the contrarian nature of this indicator.
Dec, Jan, Feb = Green = bullish > bearish
Mar, Apr, May = Red = bearish > bullish
(Bullish - Bearish) spread just reached a cycle low last week.
See the contrarian nature of this indicator.
Dec, Jan, Feb = Green = bullish > bearish
Mar, Apr, May = Red = bearish > bullish
AAII sentiment survey chart from 2010 to 2020:
Interesting:
1 notice all the "bull-bear spread lows" in the past?
(huge pessimism)
2 just before a major up-trend..
3. this time is different? (not good)

Interesting:
1 notice all the "bull-bear spread lows" in the past?
(huge pessimism)
2 just before a major up-trend..
3. this time is different? (not good)


Don't panic. bears
I trust more on what they DO, not what they SAY
what they do? CNN fear & Greed index from the trading
what they say? AAII survey
When in conflict, trust
1 CNN fear & greed index
2 $VIX & VX furures term structure
3 Equity Put/Call ratio
4 Volume divergence
I trust more on what they DO, not what they SAY
what they do? CNN fear & Greed index from the trading
what they say? AAII survey
When in conflict, trust
1 CNN fear & greed index
2 $VIX & VX furures term structure
3 Equity Put/Call ratio
4 Volume divergence
The above "what they do" list, showing:
1 neutral (CNN)
2 complacent (VIX TS)
3 "mild" greed (Equity PCR & Volume divergence)
Plus many breadth divergences
- most important hidden sentiment: what smart money has been doing under the radar
I report, you decide.

1 neutral (CNN)
2 complacent (VIX TS)
3 "mild" greed (Equity PCR & Volume divergence)
Plus many breadth divergences
- most important hidden sentiment: what smart money has been doing under the radar
I report, you decide.


below thread in Jan leading to the market crash in Feb/Mar
F&G reached 97 (intra-day 98) on Jan 2
In Fed we trust
Repo & notQE in full swing
near ZIRP
Tons of liquidity
SPX won't be allowed to drop 10 pts in election year
In Trump we trust
FOMO buy
 https://twitter.com/kerberos007/status/1210628983055945730
F&G reached 97 (intra-day 98) on Jan 2

In Fed we trust
Repo & notQE in full swing
near ZIRP
Tons of liquidity
SPX won't be allowed to drop 10 pts in election year
In Trump we trust
FOMO buy

 https://twitter.com/kerberos007/status/1210628983055945730
May 8 - short term Greed
#VIX9D = 24.89
$VIX = 27.98
$VVIX = 115.65
$SKEW = 132.21
Contango Term Structure = short-term greed
#VIX9D < $VIX Contango
$VIX < #VIX3M Contango
#VIX3M < #VIX6M Contango
#VIX6M > #VIX1Y Backwardation
#VIX9D = 24.89
$VIX = 27.98
$VVIX = 115.65
$SKEW = 132.21
Contango Term Structure = short-term greed
#VIX9D < $VIX Contango
$VIX < #VIX3M Contango
#VIX3M < #VIX6M Contango
#VIX6M > #VIX1Y Backwardation
Below is much more accurate than AAII sentiment survey from my backtesting
Total Equity Put/Call ratio from all 16 options exchanges.
not CBOE put/call ratio that I post everyday
CBOE is about 12% of all equity options & 98% of all Index options https://twitter.com/kerberos007/status/1254097955029749761
Total Equity Put/Call ratio from all 16 options exchanges.
not CBOE put/call ratio that I post everyday
CBOE is about 12% of all equity options & 98% of all Index options https://twitter.com/kerberos007/status/1254097955029749761
CBOE Call/Put Ratio (PCR reversed) 10d SMA
Euphoria and capitulation zones defined.
Not as accurate as above "total equity call/put ratio", but, a very good contrarian indicator around the turning levels.
Need confluence from other cross-asset & breadth & sentiment indicators
Euphoria and capitulation zones defined.
Not as accurate as above "total equity call/put ratio", but, a very good contrarian indicator around the turning levels.
Need confluence from other cross-asset & breadth & sentiment indicators
Total equity call/put ratio from 16 exchanges
Updated as of Fri, May 8 2020
neutral & complacent
BTFD at capitulation zone is more accurate than top picking
Top picking need other confluence from cross-asset & breadth & sentiment indicators. (I have more than 50+ combined)
Updated as of Fri, May 8 2020
neutral & complacent
BTFD at capitulation zone is more accurate than top picking
Top picking need other confluence from cross-asset & breadth & sentiment indicators. (I have more than 50+ combined)
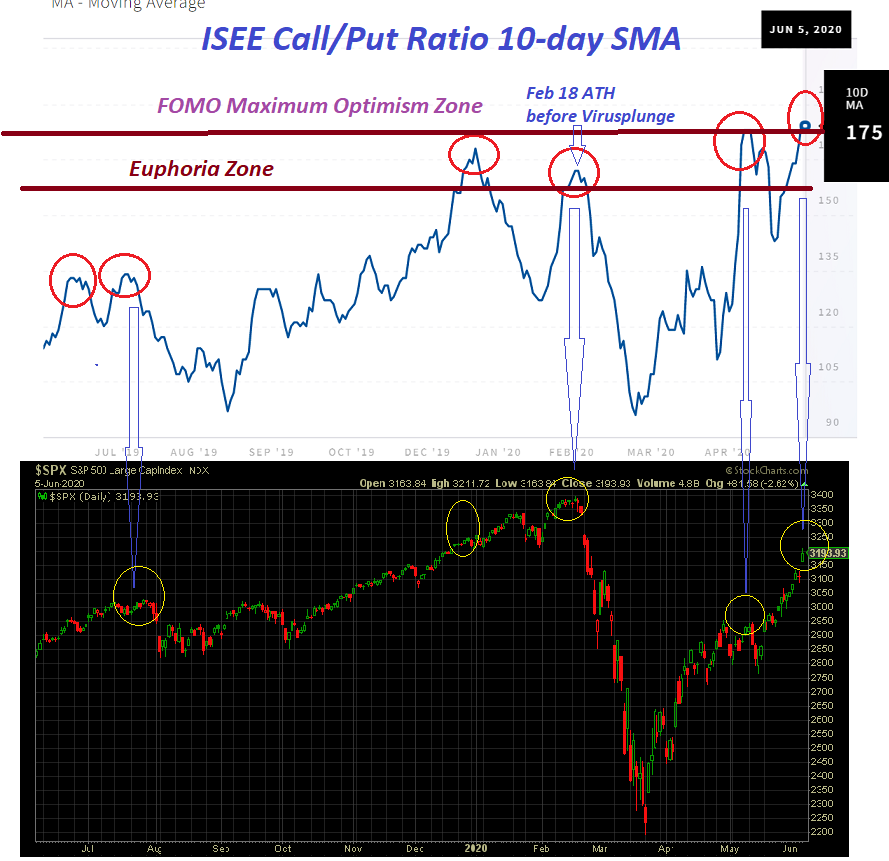
ISEE Call/Put ratio: 10d sma
MMs & firm trades, excluded, are not considered representative of true market sentiment due to their specialized nature. ISEE method allows for a more accurate measure of true investor sentiment than traditional P/C ratios
Now higher than Dec & Jan
MMs & firm trades, excluded, are not considered representative of true market sentiment due to their specialized nature. ISEE method allows for a more accurate measure of true investor sentiment than traditional P/C ratios
Now higher than Dec & Jan
Interesting $USO chart.
Reverse-split adjusted price.
$950 in Oct 2007 - amazing.
and the volume last week? 30x avg volume (20 day)
Reverse-split adjusted price.
$950 in Oct 2007 - amazing.
and the volume last week? 30x avg volume (20 day)
BDI leading indicator: predicted Oil plunge in Jan 2020. https://twitter.com/kerberos007/status/1253791449239433216
6 Reasons Why Goldman Sees The S&P Sliding Back To 2,400 By August
"There are a number of concerns and risks exist that we believe, and our client discussions confirm, investors are downplaying."
- Wait, that's my target. Haha. $GS following me?
 https://www.zerohedge.com/markets/6-reasons-why-goldman-sees-sp-sliding-back-2400-august
"There are a number of concerns and risks exist that we believe, and our client discussions confirm, investors are downplaying."
- Wait, that's my target. Haha. $GS following me?

 https://www.zerohedge.com/markets/6-reasons-why-goldman-sees-sp-sliding-back-2400-august
Old post:
I will need to change my 2,425 target because of $GS https://twitter.com/kerberos007/status/1249426071835021313
I will need to change my 2,425 target because of $GS
 https://twitter.com/kerberos007/status/1249426071835021313
See above thread regarding
1 CBOE p/c ratios (index, total, equity, ETP)
2 ISEE c/p ratio
3 total equity c/p ratio from all 16 exchg
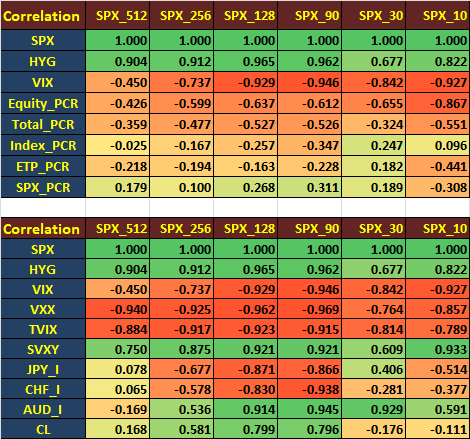
I have new corr proof that $SPX is highly correlated with CBOE $CPCE (equity p/c ratio) as shown below.
As good as $VIX from 512d to 10d corr
1 CBOE p/c ratios (index, total, equity, ETP)
2 ISEE c/p ratio
3 total equity c/p ratio from all 16 exchg
I have new corr proof that $SPX is highly correlated with CBOE $CPCE (equity p/c ratio) as shown below.
As good as $VIX from 512d to 10d corr
Correlation table with other cross assets
512-day to 10-day correlation.
$AUD_I index ( #AUDUSD also) is the new FX correlation star: highly correlated with $SPX from 128d to 30d
$HYG $VIX $TVIX & $UVXY are no brainer.
512-day to 10-day correlation.
$AUD_I index ( #AUDUSD also) is the new FX correlation star: highly correlated with $SPX from 128d to 30d
$HYG $VIX $TVIX & $UVXY are no brainer.
In statistics, the phrase "correlation does not imply causation" refers to inability to legitimately deduce a cause&effect relationship between 2 variables solely on the basis of an observed correlation
But, In trading, if you add more corre confluence, finding divergences


But, In trading, if you add more corre confluence, finding divergences


1 drawback of below corr matrix is: it can only display a single corr period
2 Need a 3D to see the corr overtime, finding the divergence from the norm in shorter timeframe
3 A corr table with diff periods among assets would easily spot div in real-time https://twitter.com/kerberos007/status/1212532772344147974
2 Need a 3D to see the corr overtime, finding the divergence from the norm in shorter timeframe
3 A corr table with diff periods among assets would easily spot div in real-time https://twitter.com/kerberos007/status/1212532772344147974
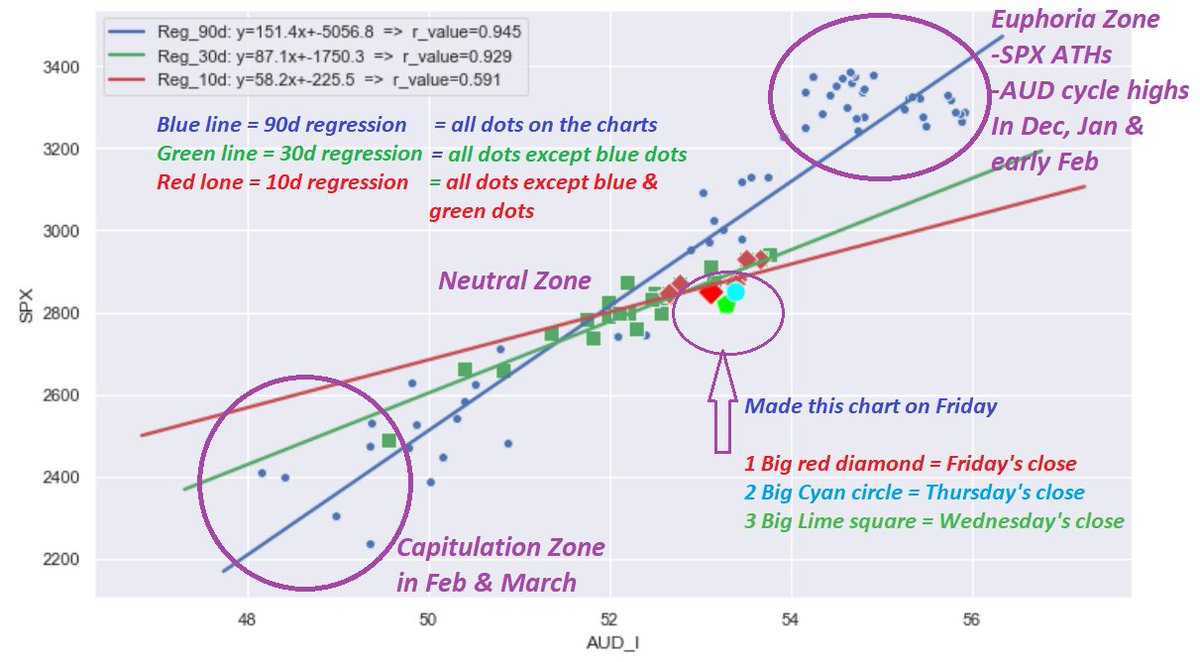
SPX:AUD chart: Friday's close.
More visual to spot the divergences and the "capitulation" & "euphoria" zones over time
A: 3 regression lines for more confluence
B: Euphoria zone in Dec, Jan & Feb
C: Capitulation Zone in Feb & Mar
D: Current position relative to the past 90 days
More visual to spot the divergences and the "capitulation" & "euphoria" zones over time
A: 3 regression lines for more confluence
B: Euphoria zone in Dec, Jan & Feb
C: Capitulation Zone in Feb & Mar
D: Current position relative to the past 90 days
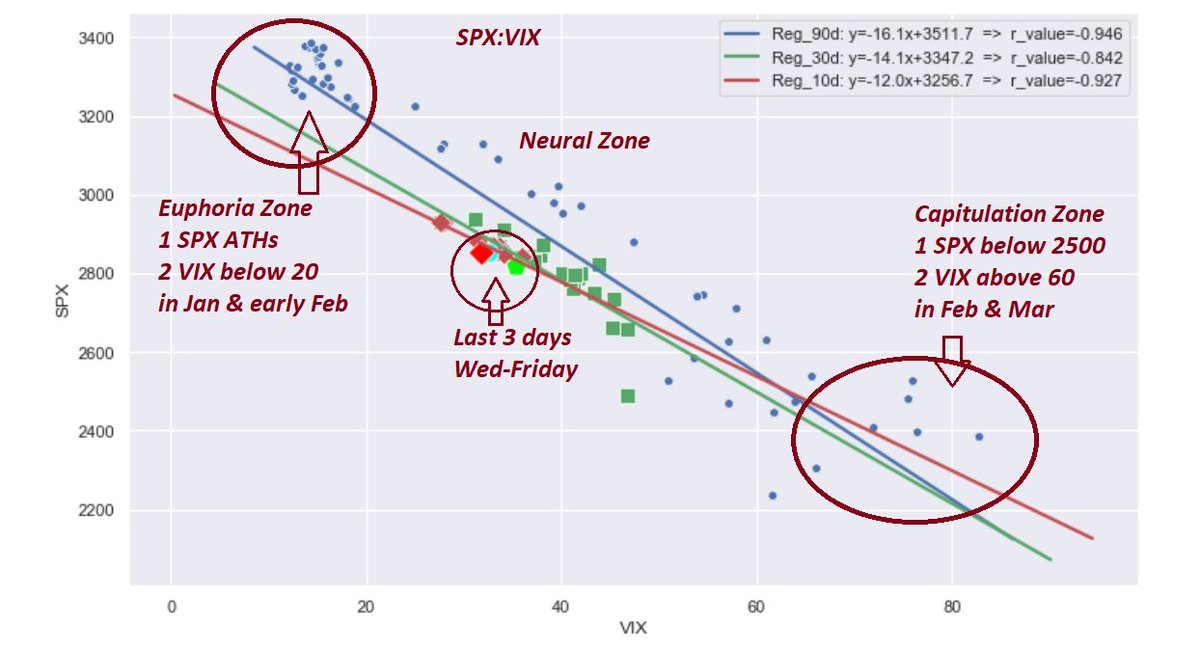
Trade the correlation/regression charts in swing & day/scalping trading
1 for swing trading, look for divergences in daily chart
2 for scalping, if last 10 days' dots were near regression line (correlated), looking for divergence in 15-min, confirmed by more cross-asset diverg
1 for swing trading, look for divergences in daily chart
2 for scalping, if last 10 days' dots were near regression line (correlated), looking for divergence in 15-min, confirmed by more cross-asset diverg

AAII bullish and Bearish weekly sentiment survey
from 2010 to 2020
6/5/2020 = Extreme Bearish
green = bullish
red = bearish
blue = 5-period SMA (spread) = bullish - bearish
from 2010 to 2020
6/5/2020 = Extreme Bearish
green = bullish
red = bearish
blue = 5-period SMA (spread) = bullish - bearish
AAII Sentiment survey update: 6/5/2020
(Bullish - Bearish) spread reached another cycle low last few weeks.
Since March, AAII survey turned "red"
 Super-duper "bullish" in Dec & Jan.
(Bullish - Bearish) spread reached another cycle low last few weeks.
Since March, AAII survey turned "red"
 Super-duper "bullish" in Dec & Jan.
Above AAII sentiment survey was "what they say"
Below CNN fear & greed indicator is "what they do"
Opposite direction. You decide
Fear & Greed Index = 66 = Greed
This thread from the top contains some useful info and million $ trading tips


Below CNN fear & greed indicator is "what they do"
Opposite direction. You decide
Fear & Greed Index = 66 = Greed

This thread from the top contains some useful info and million $ trading tips


Alert: Maximum Optimism: FOMO
Below is a more accurate ind than AAII sentiment survey from my backtesting: I am biased
Total equity call/put ratio from all 16 exchanges
not CBOE P/C ratio that I post daily
CBOE is about 14% of all equity options
All-In Maximum Optimism

Below is a more accurate ind than AAII sentiment survey from my backtesting: I am biased
Total equity call/put ratio from all 16 exchanges
not CBOE P/C ratio that I post daily
CBOE is about 14% of all equity options
All-In Maximum Optimism


Alert: Maximum optimism
ISEE C/P ratio: 10d sma
MM & firm trades, excluded, are not considered representative of true market sentiment due to their specialized nature. ISEE method allows for a more accurate measure of true investor sentiment than traditional P/C ratios
All-in
ISEE C/P ratio: 10d sma
MM & firm trades, excluded, are not considered representative of true market sentiment due to their specialized nature. ISEE method allows for a more accurate measure of true investor sentiment than traditional P/C ratios
All-in
To sum it up
Why would market crash?
1 "maximum FOMO optimism" just before the crash
2 irratianal exuberance drives stonks super overvaluation
3 taxi drivers all-in buying stonk calls
4 smart money on the other side waiting patiently
5 wealth transfer https://twitter.com/kerberos007/status/1267991509128937472
Why would market crash?
1 "maximum FOMO optimism" just before the crash
2 irratianal exuberance drives stonks super overvaluation
3 taxi drivers all-in buying stonk calls
4 smart money on the other side waiting patiently
5 wealth transfer https://twitter.com/kerberos007/status/1267991509128937472

 Read on Twitter
