After yesterday's poll, a thread. This plot shows the 2m temperature provided by @ECMWF
's #era5 reanalysis, (1) averaged over the globe and (2) averaged for all glacier locations (weighted by glacier area). Glacier locations warming is almost threefold the global rate. Why? 1/6
's #era5 reanalysis, (1) averaged over the globe and (2) averaged for all glacier locations (weighted by glacier area). Glacier locations warming is almost threefold the global rate. Why? 1/6
First, because warming above land areas is stronger than above oceans (on average). This gives a more nuanced picture, but still, warming is more pronounced at glacier locations than on land (but “only” of a factor 1.5). 2/6
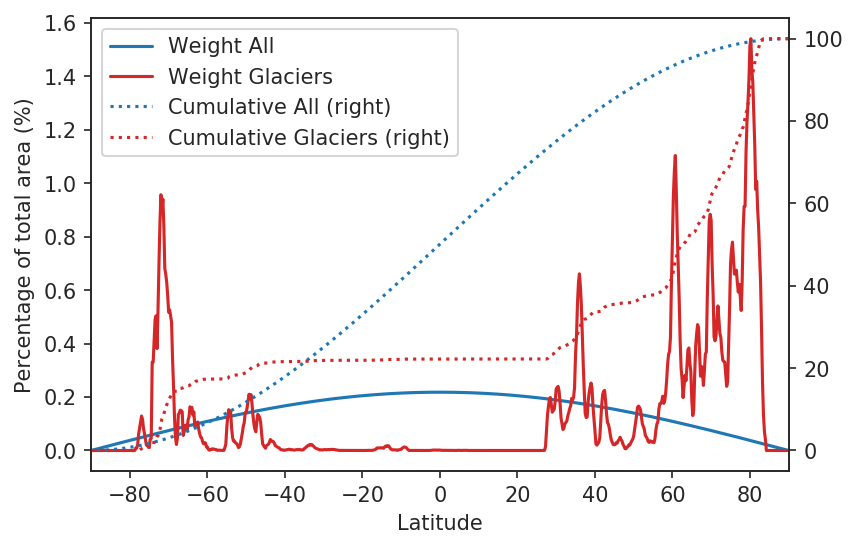
Second, warming is stronger at northern latitudes. This is called "polar amplification", and can be seen by looking at the temperature trends averaged over latitude bands. Most areas have a warming of about 0.2°C per decade, which goes up to more than 0.5°C at high latitudes. 3/6
Since the majority of mountain glaciers tend to be located at high latitudes, this will move the global average towards warmer temperature. 50% of the world's glaciers area is located north of 63°N, although this region represents only about 5% of the Earth’s surface. 4/6
Third: is there an elevation dependent warming? This is more controversial. There are indications of elevation dependent warming in the ERA5 dataset, as shown by this map of the computed trends  , but this has not been analyzed before (I hope someone will). 5/6
 , but this has not been analyzed before (I hope someone will). 5/6
Finally: this is NOT peer-reviewed work, and these results should be interpreted with all due caution. Code, data and details are available at this link: https://fabienmaussion.info/2019/08/29/era5 . Analyses powered by @xarray_dev , @matplotlib , @HoloViz_org. 6/6

 Read on Twitter


