Some time ago I created this chart to find that passing offense is the most stable part of a team.
@tpmcd67 kindly asked me to do the same when predicting a single game after X weeks. I thought this is interesting so I dove into the data again. 1/n https://twitter.com/Moo12152/status/1054732303602200576?s=20
@tpmcd67 kindly asked me to do the same when predicting a single game after X weeks. I thought this is interesting so I dove into the data again. 1/n https://twitter.com/Moo12152/status/1054732303602200576?s=20
Here I predict 8 team metrics in a given game from previous games. The relations between the curves are not really surprising and reflect the old finding.
The new thing is that the curves seem to become stationary after roughly 7-8 games. That's when we know enough about teams.
The new thing is that the curves seem to become stationary after roughly 7-8 games. That's when we know enough about teams.
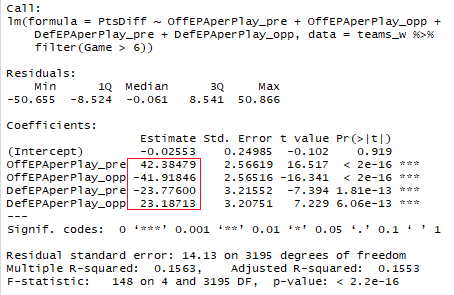
Here I predict point differential. The best predictor is point differential (purple) itself or a weighted sum of offense & defense (yellow).
Here I use only the yellow curve (which now blue) and compare it to a model which additionally uses a prior from last season. One can see that game 7 seems to be a good point to forget about our priors from last year.
The last week is a weird anomaly in the data.
The last week is a weird anomaly in the data.
In other words if the division rivial of your team which you laughed at for a long time is suddenly good and looks like a contender, you can live in the state of denial for 6 or 7 weeks until you should acknowledge that they might be for real.
Here is the code and a csv file (generated by the code) which carries game by game information for the last 10 years, and from which all the charts can be reproduced. https://github.com/Moo-R/nfl
The overall takeaway from this is that if one only uses the result of all plays of a team, the passing offense is the unit which carries all the signal and which allows us to do predictions.
However this does not mean that defense is completely useless. It is possible that one can find metrics that don't look at the result of a play (for instance what PFF does or tracking data yields a lot of possibilities) and are better at using defense for forecasting.
This will very likely never close the gap between offense and defense but it might be possible to narrow it.
Here is another plot demonstrating that the defensive performance in a given game is best predicted (using only information from previous games) by the opposing offense.
The best fit is obtained by weighting opposing offense roughly twice as much.
The best fit is obtained by weighting opposing offense roughly twice as much.

 Read on Twitter


