Either person will show some patterns, support & resistance/trendlines or use some indicator technique. 2/3
What are chart patterns ?
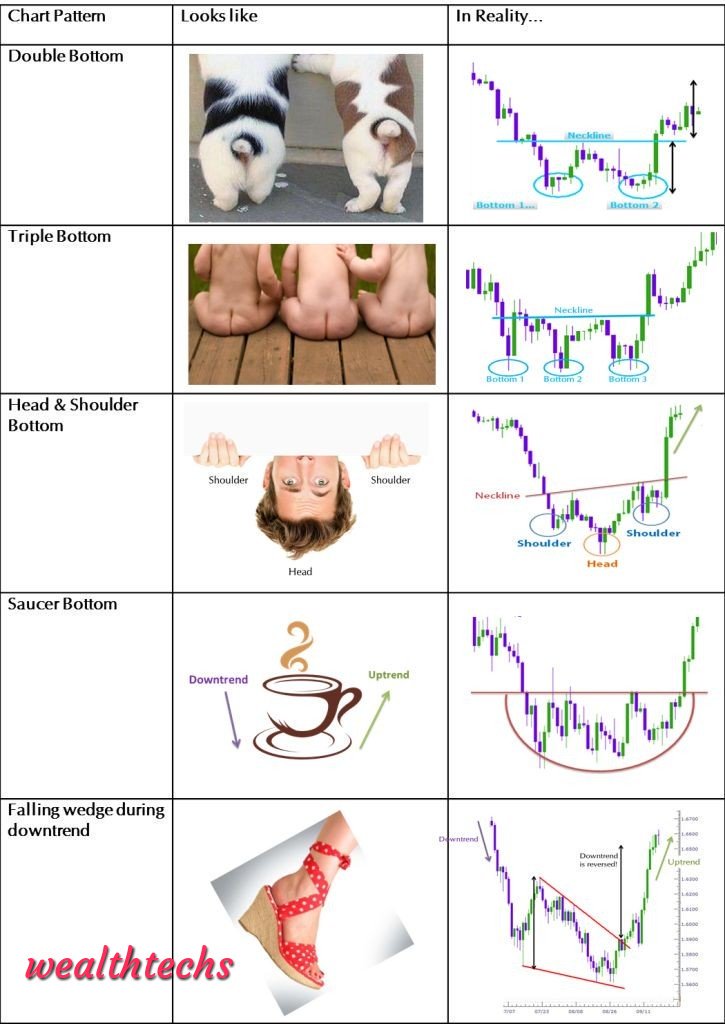
A chart pattern or price pattern is a pattern within a chart when prices are graphed. Patterns are formed by sentiments of people try to understand that sentiments don't waste time in finding patterns. 3/4
A chart pattern or price pattern is a pattern within a chart when prices are graphed. Patterns are formed by sentiments of people try to understand that sentiments don't waste time in finding patterns. 3/4
What is Support & Resistance ?
Support and resistance is perhaps the most common trading tool a chartist uses. Becoz of that, it is often one of the most misused too. They are ideally a demand & supply region on charts, You can call it as crucial point 4/5
Support and resistance is perhaps the most common trading tool a chartist uses. Becoz of that, it is often one of the most misused too. They are ideally a demand & supply region on charts, You can call it as crucial point 4/5
What are indicators ?
Technical indicators are mathematical calculations based on the price, volume, or open interest of a security or contract. Like RSI, MACD, Moving Average etc. 5/6
Technical indicators are mathematical calculations based on the price, volume, or open interest of a security or contract. Like RSI, MACD, Moving Average etc. 5/6
When Charts are posted its just observation at that point in time, its not a trading decision, trading decision comes when you watch & follow through, observation changes to solid opinions on real time screen decision with action in your trading account.6/7

 Read on Twitter
 1/2
1/2


