1/ A man is either a librarian or a salesman. He's retiring. What are the odds that he is a librarian?
A lot of people say, "The odds that he’s a librarian must be at least 90 percent.” That's the story, librarians don't work super hard. https://fs.blog/2012/11/mental-model-bias-from-insensitivity-to-base-rates/
A lot of people say, "The odds that he’s a librarian must be at least 90 percent.” That's the story, librarians don't work super hard. https://fs.blog/2012/11/mental-model-bias-from-insensitivity-to-base-rates/
2/ The trouble with this logic is in the US, salesmen outnumber male librarians 100 to 1. Before you even considered the fact the man is “retiring,” you should have assigned only a 1 percent chance he was a librarian.
Ignoring the base rate can lead you wildly astray.
Ignoring the base rate can lead you wildly astray.
3/ Base rate thread 
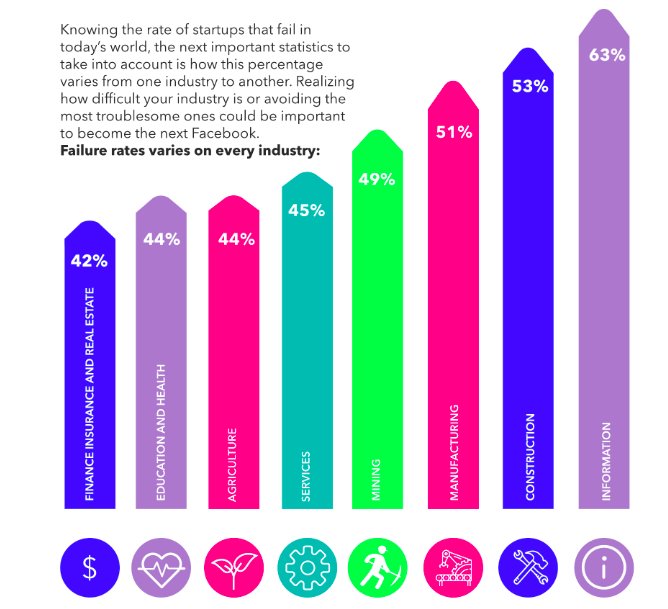
Base rates can be thought of as a frame of reference. For example, if you wanted to start a construction company, what are your odds of success?
Apparently, it's 47%. The idea is that base rates, a group of prior data points, give you starting point.

Base rates can be thought of as a frame of reference. For example, if you wanted to start a construction company, what are your odds of success?
Apparently, it's 47%. The idea is that base rates, a group of prior data points, give you starting point.
4/ If you want to to stop reading this and read another thread by someone much smarter than me... @jposhaughnessy https://twitter.com/jposhaughnessy/status/1089285613621309441
5/ ...alas, if you're still here, let's carry on.
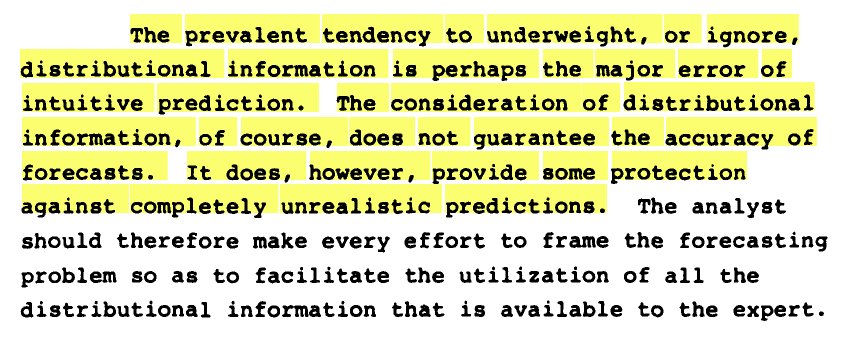
With a big sample size, we let history guide our view of what is realistic.
Daniel Kahneman and Amos Tversky have a great paper on this: https://apps.dtic.mil/dtic/tr/fulltext/u2/a047747.pdf
With a big sample size, we let history guide our view of what is realistic.
Daniel Kahneman and Amos Tversky have a great paper on this: https://apps.dtic.mil/dtic/tr/fulltext/u2/a047747.pdf
6/ But @mjmauboussin adapted this into a fantastic paper on base rates for public companies. He looked at 65 years of data among thousands of companies with different metrics.
https://www.valuewalk.com/wp-content/uploads/2016/10/document-1065113751.pdf
https://www.valuewalk.com/wp-content/uploads/2016/10/document-1065113751.pdf
7/ Before getting into the data, we need to be clear on a few things.
1. Inside vs. outside views.
The inside view is when you are well acquainted with one example.
The outside view, or the base rate, is looking at a lot of similar examples.
1. Inside vs. outside views.
The inside view is when you are well acquainted with one example.
The outside view, or the base rate, is looking at a lot of similar examples.
8/ Kahneman/Tversky use project management as an example.
Most people overestimate how quickly they can finish a project b/c they are acquainted with the inputs. But what if you asked what the base rate for how long a similar project took?
Most people overestimate how quickly they can finish a project b/c they are acquainted with the inputs. But what if you asked what the base rate for how long a similar project took?
9/
2. The luck/skill continuum
The more skill that is involved, the more the inside view should be weighted. However, if we start from the inside view we anchor too heavily to that b/c we underestimate the role of luck.
Here's a fun chart
2. The luck/skill continuum
The more skill that is involved, the more the inside view should be weighted. However, if we start from the inside view we anchor too heavily to that b/c we underestimate the role of luck.
Here's a fun chart

10/
3. As humans, we love a good story.
The problem is that stories can make us feel like we have the inside view when the right approach is to take the outside view.
http://www.safalniveshak.com/wp-content/uploads/2012/08/Value-Investing-The-Sanjay-Bakshi-Way-Safal-Niveshak-Special.pdf
3. As humans, we love a good story.
The problem is that stories can make us feel like we have the inside view when the right approach is to take the outside view.
http://www.safalniveshak.com/wp-content/uploads/2012/08/Value-Investing-The-Sanjay-Bakshi-Way-Safal-Niveshak-Special.pdf
11/
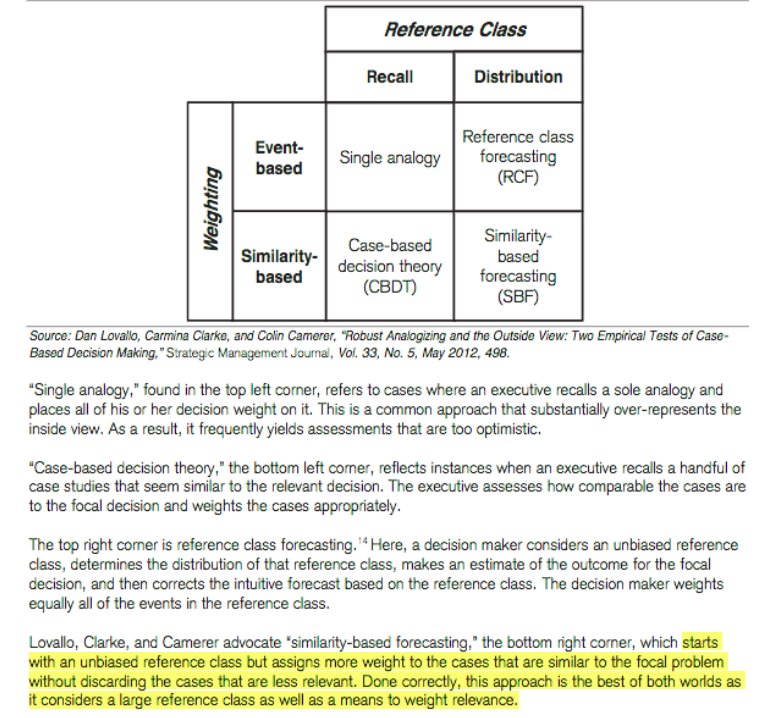
So what are we to do? Well, back to Mauboussin.
Step 1. Start with base rate data.
Step 2. Assign more weight to examples that are closer to the inside view.
So what are we to do? Well, back to Mauboussin.
Step 1. Start with base rate data.
Step 2. Assign more weight to examples that are closer to the inside view.
12/
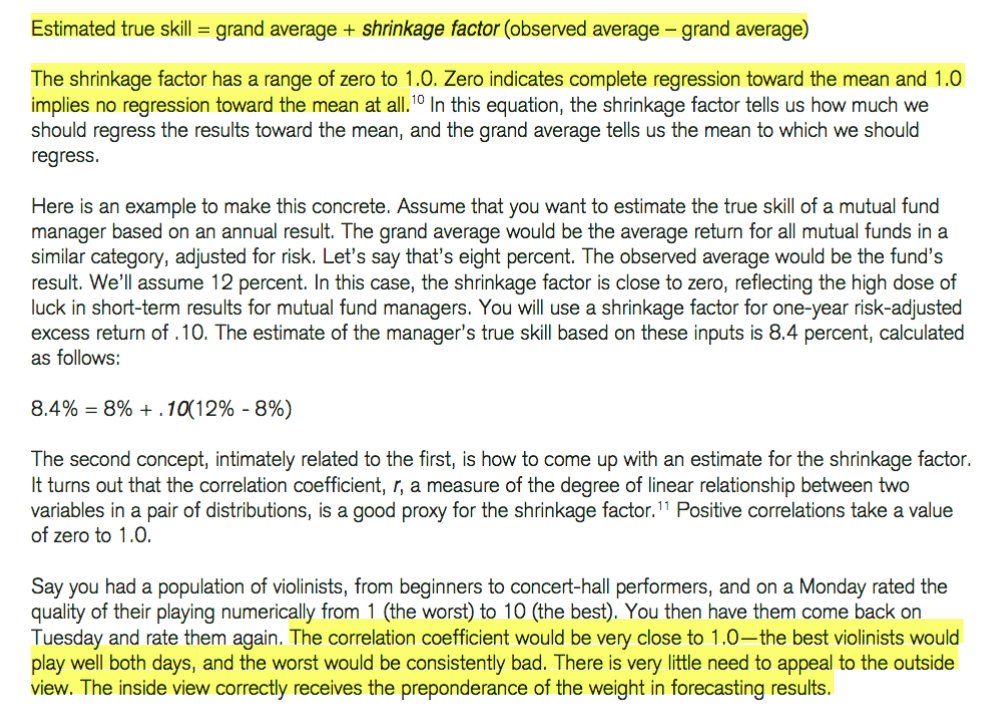
For some more concrete ways to predict the future, look at shrinkage factors in relation to base rates.
Only skill-based = shrinkage of 1
Only luck-based = shrinkage of 0
Then you can weight the probabilities.
For some more concrete ways to predict the future, look at shrinkage factors in relation to base rates.
Only skill-based = shrinkage of 1
Only luck-based = shrinkage of 0
Then you can weight the probabilities.
13/ Ok, now a stock example.
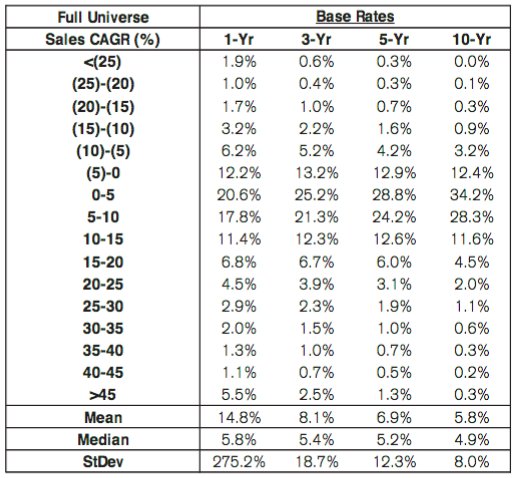
This is the percentage of companies between 1950-2015 that achieved these sales growth numbers over 1, 3 and 5 years.
0.3% of the companies grew over 45% for 10 years in other words, 133 out of 41,645 companies
This is the percentage of companies between 1950-2015 that achieved these sales growth numbers over 1, 3 and 5 years.
0.3% of the companies grew over 45% for 10 years in other words, 133 out of 41,645 companies
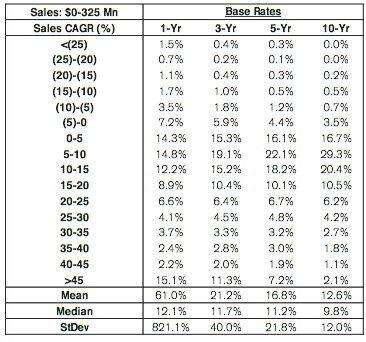
14/ As an aside, a testament to the Law of Large numbers, companies with revenues sub-$325 million, were 6x more likely to grow sales 45%+ for at least five years. But still only 7.2% vs. 1.3%.
15/ So the takeaway is that if you are trying to predict something
1. First look at the base rate as a frame of reference
2. Decide where your subject is on the skill/luck continuum
3. Weight other examples accordingly so you aren't overly optimistic
1. First look at the base rate as a frame of reference
2. Decide where your subject is on the skill/luck continuum
3. Weight other examples accordingly so you aren't overly optimistic
16/
Base rates go against our nature because we love stories, we easily remember what happened most recently, and it's fun to make predictions.
But good thinking isn't always the easiest, most fun. @farnamstreet https://fs.blog/2012/12/three-things-to-consider-in-order-to-make-an-effective-prediction/
Base rates go against our nature because we love stories, we easily remember what happened most recently, and it's fun to make predictions.
But good thinking isn't always the easiest, most fun. @farnamstreet https://fs.blog/2012/12/three-things-to-consider-in-order-to-make-an-effective-prediction/
Fin/
I also wrote a blog post on this. Enjoy! https://www.investingcity.org/blog/a-foundation-to-stand-on
I also wrote a blog post on this. Enjoy! https://www.investingcity.org/blog/a-foundation-to-stand-on

 Read on Twitter